Knows where your gross goes
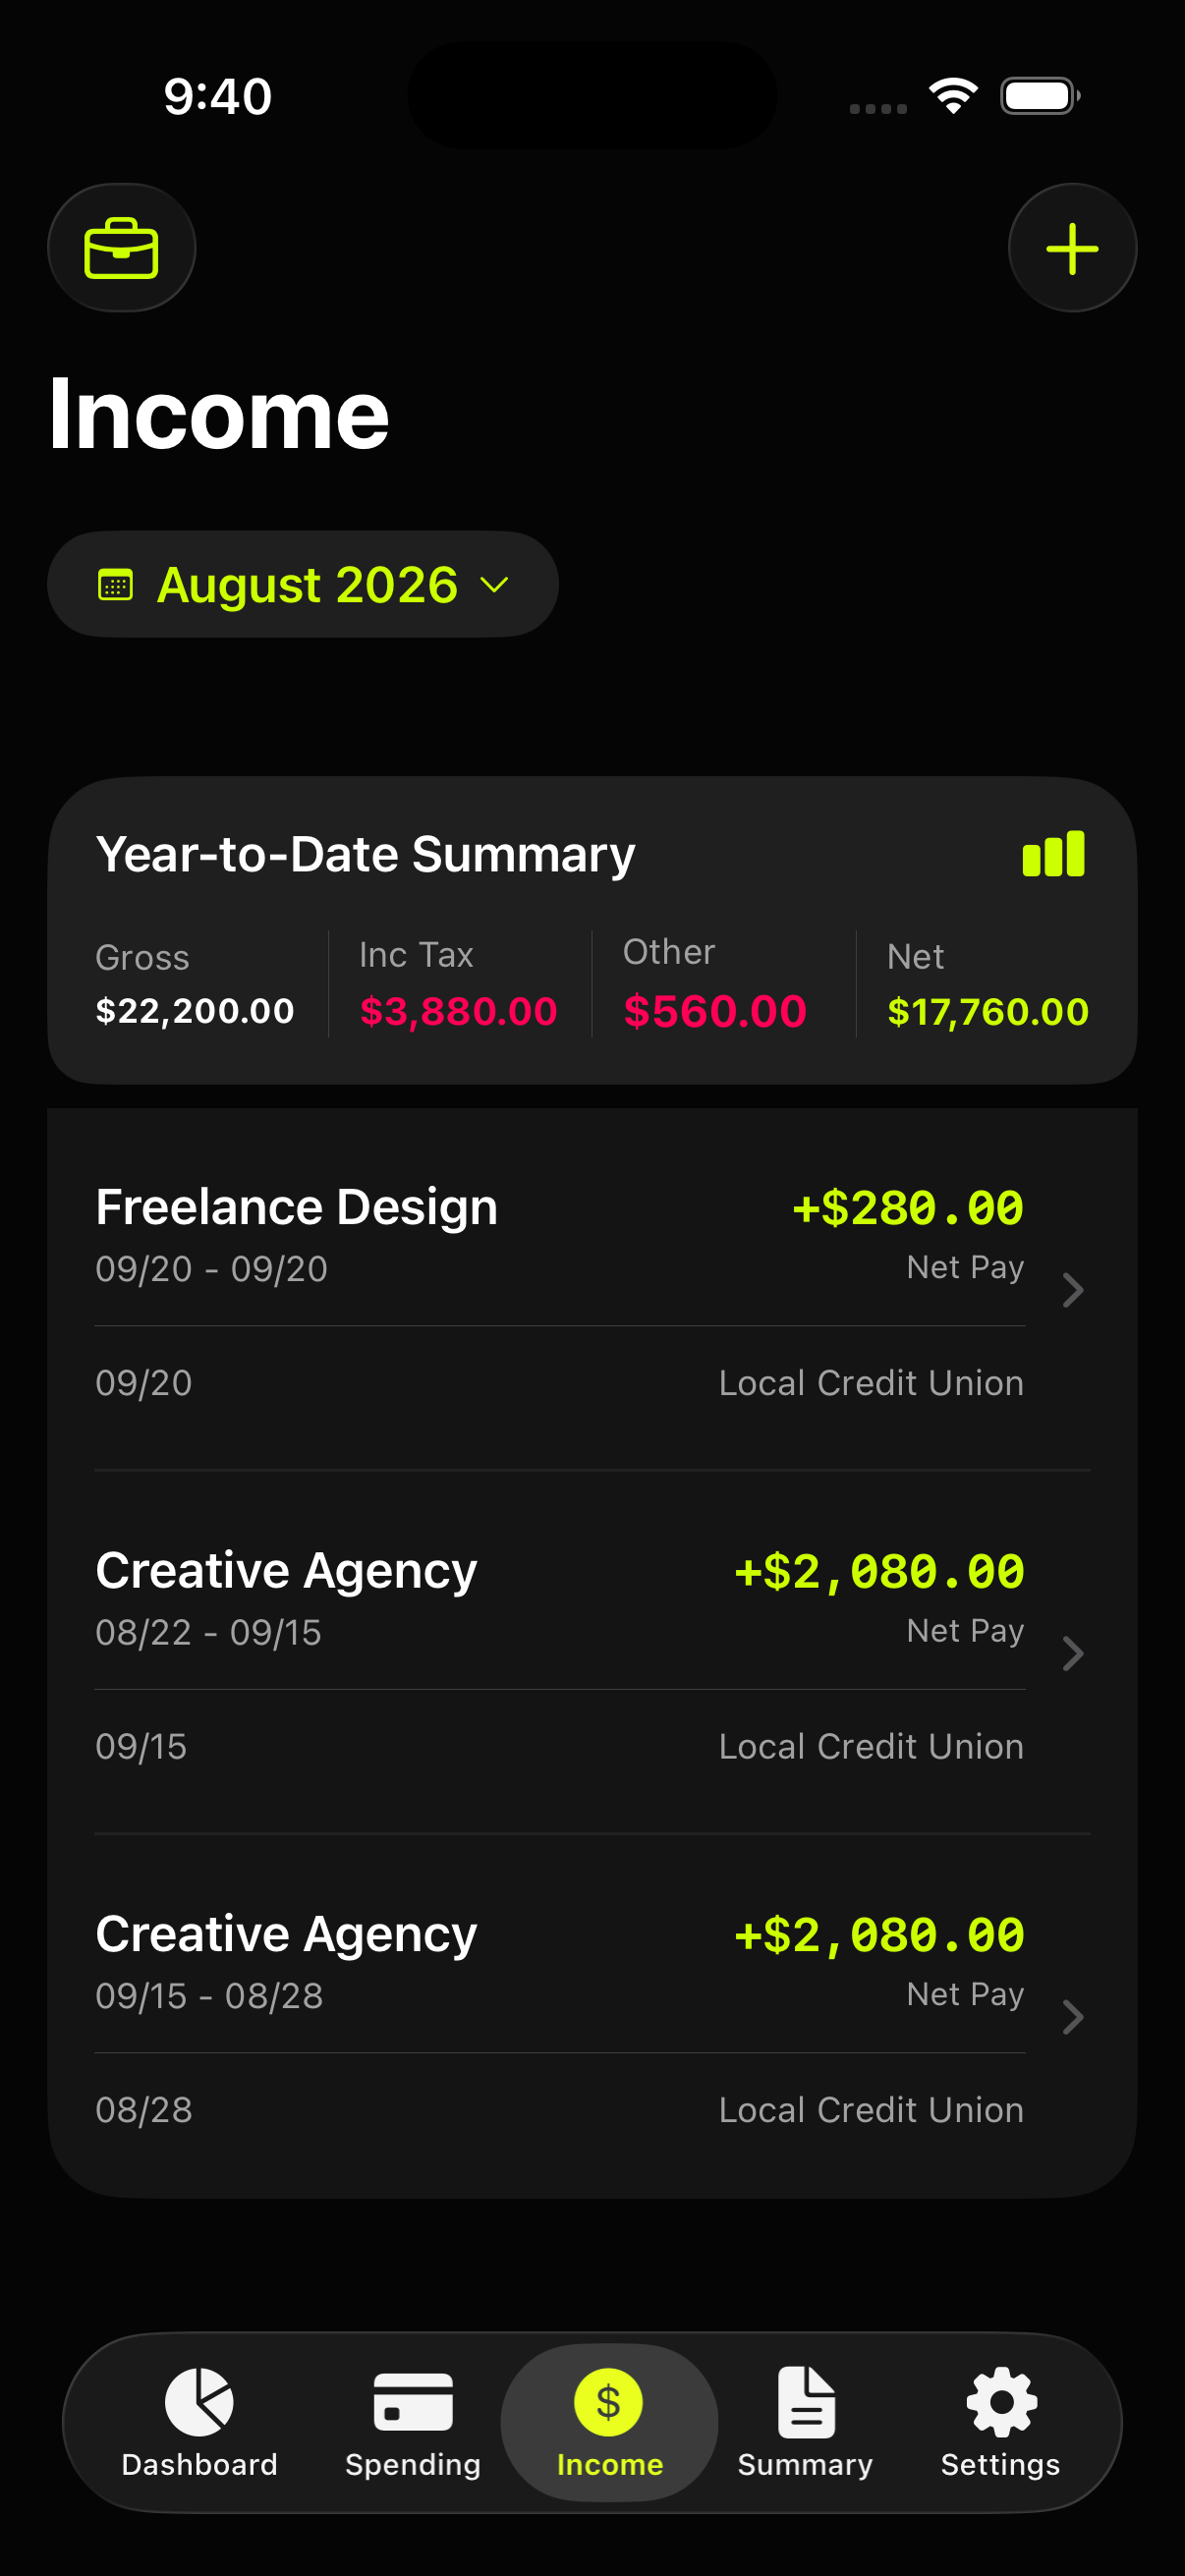
Set an employer up once with a typical paystub and WiseMoney learns how your pay splits. Every payslip after that takes two numbers — gross and net — and it estimates the tax and deductions in between.
Employer profilesA money tracker for people whose income is the complicated part. Track each employer separately, see what your gross turns into after tax and deductions, and keep all of it on your phone — no bank login, ever.
Most budgeting apps are advertising companies. This one isn’t.
Set an employer up once with a typical paystub and WiseMoney learns how your pay splits. Every payslip after that takes two numbers — gross and net — and it estimates the tax and deductions in between.
Employer profilesWiseMoney never links to your bank. There is no Plaid, no WiseMoney account, and no server of ours holding your ledger. Your data stays on your phone — it never reaches us, because there is nowhere for it to go.
How we protect you →Money moved into savings or investments isn’t an expense — it’s wealth. WiseMoney is one of the few trackers that counts it that way.
Savings · InvestingGenerate a polished PDF statement or dump everything to CSV in one tap. Your data leaves whenever you want it to — on your terms.
PDF · CSVEvery image below is the shipping app — not a mockup.
Most money apps assume one salary landing in one account. WiseMoney assumes the opposite.
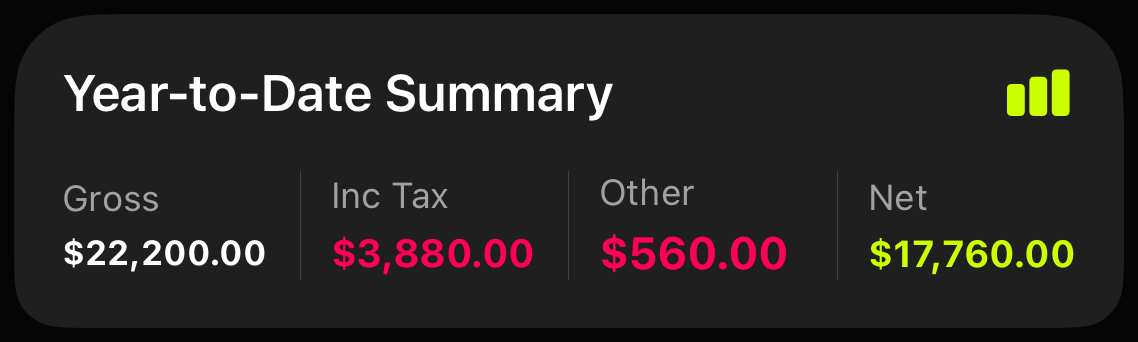
Give each job its own profile and WiseMoney keeps year-to-date gross, tax, deductions, and true take-home separate for each one. A day job and freelance work sit side by side instead of being averaged into a single misleading number.
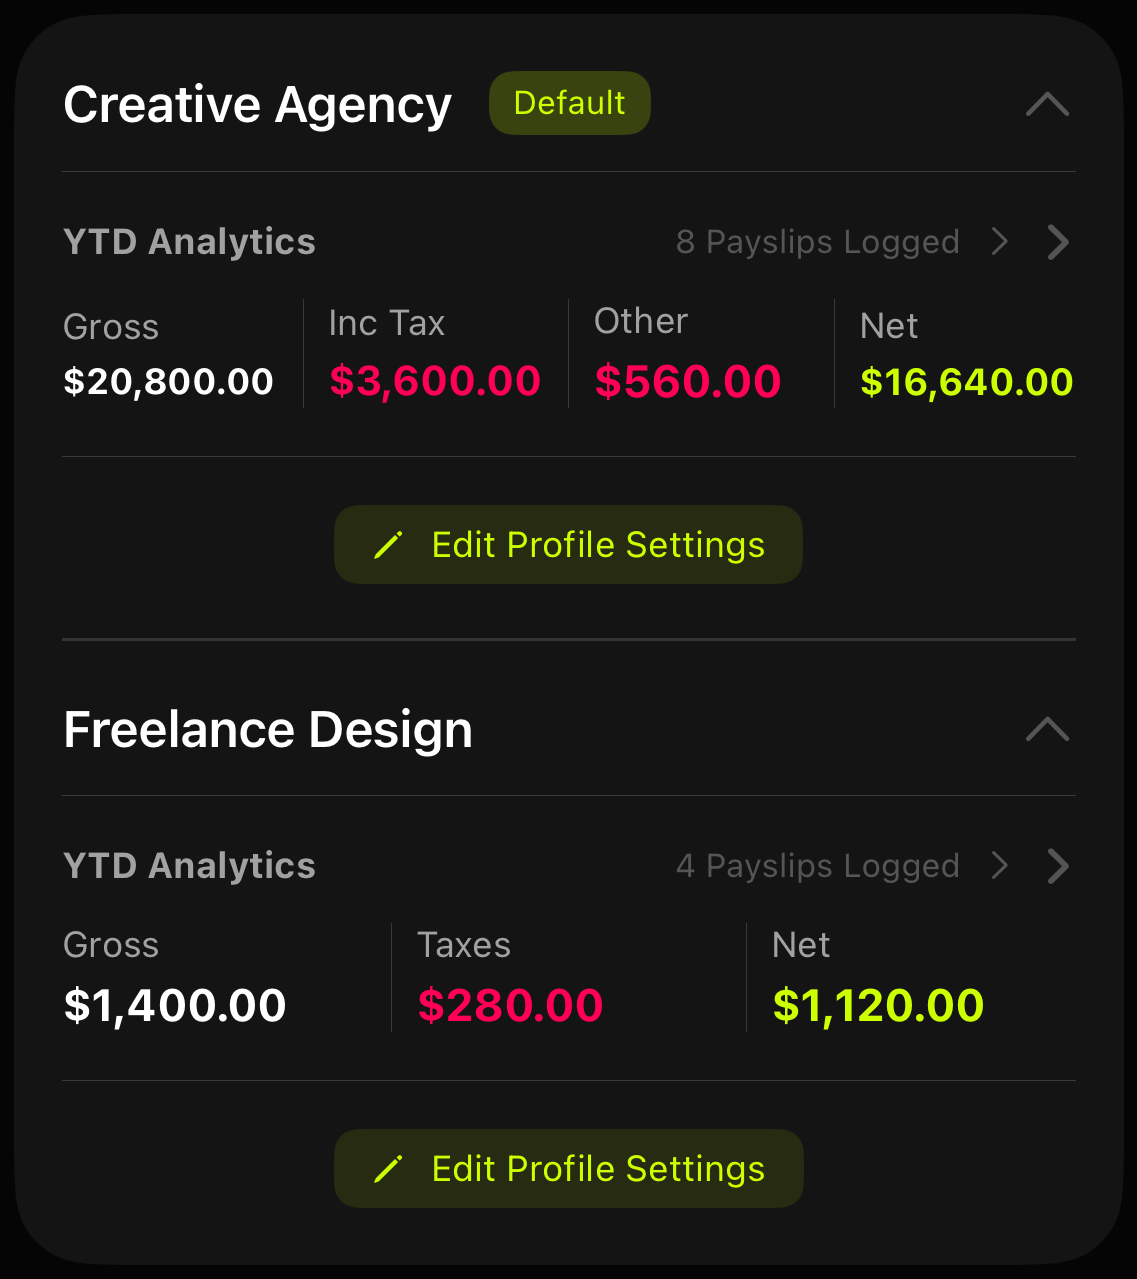
Enter one typical paystub — gross, net, income tax, deductions — and WiseMoney learns how that employer splits the gap. From then on a payslip needs gross and net; it estimates the rest, so you can see roughly what went to tax and what went to your 401(k) and insurance instead of watching one number land in your account.
Estimates, not filings. The split is modelled from the paystub you gave it.
Once take-home is honest, the spending side finally means something.
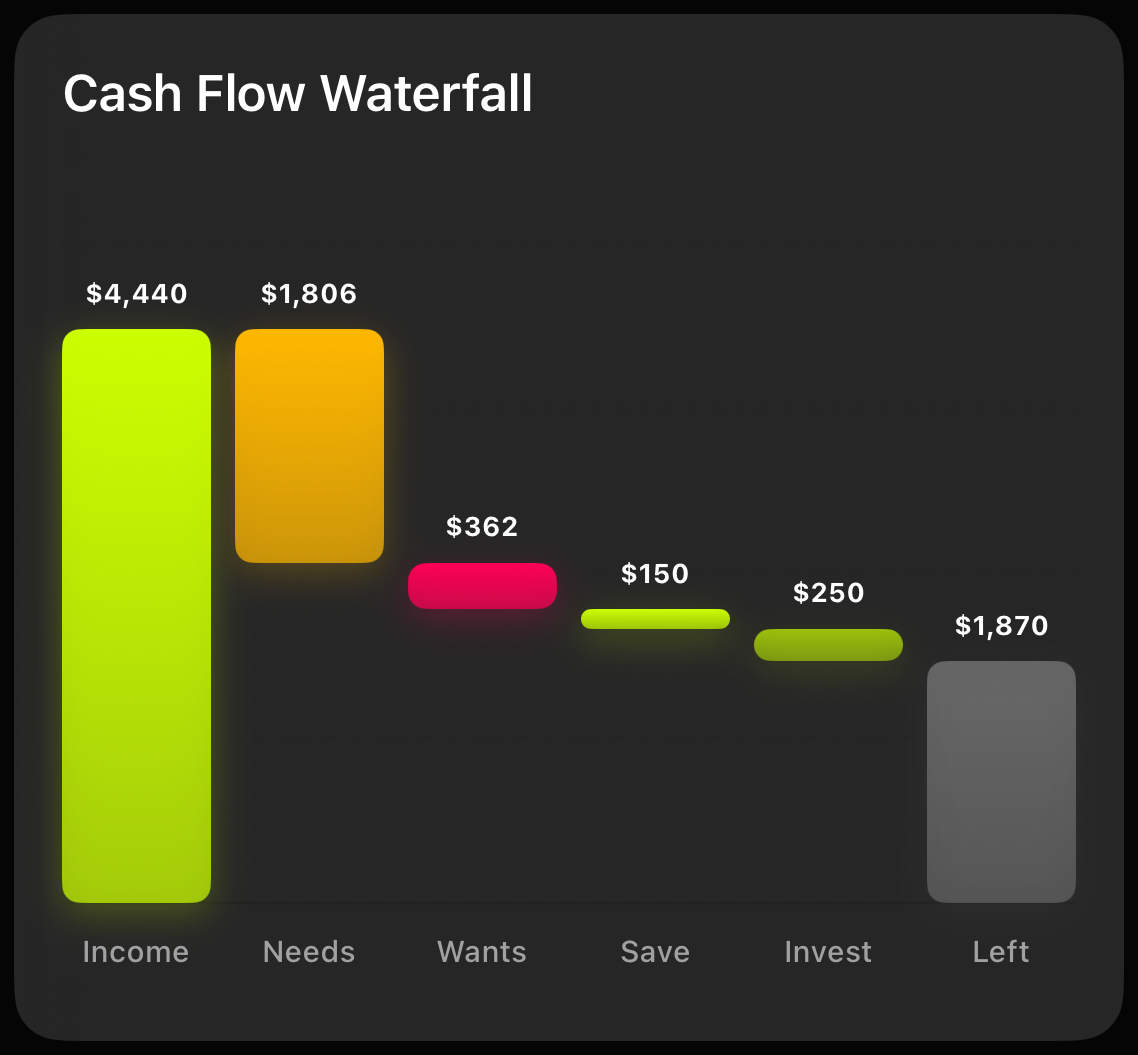
The Cash Flow Waterfall shows exactly where your income lands — needs, wants, savings, investments — and what survives to the end of the month. One chart instead of a spreadsheet.
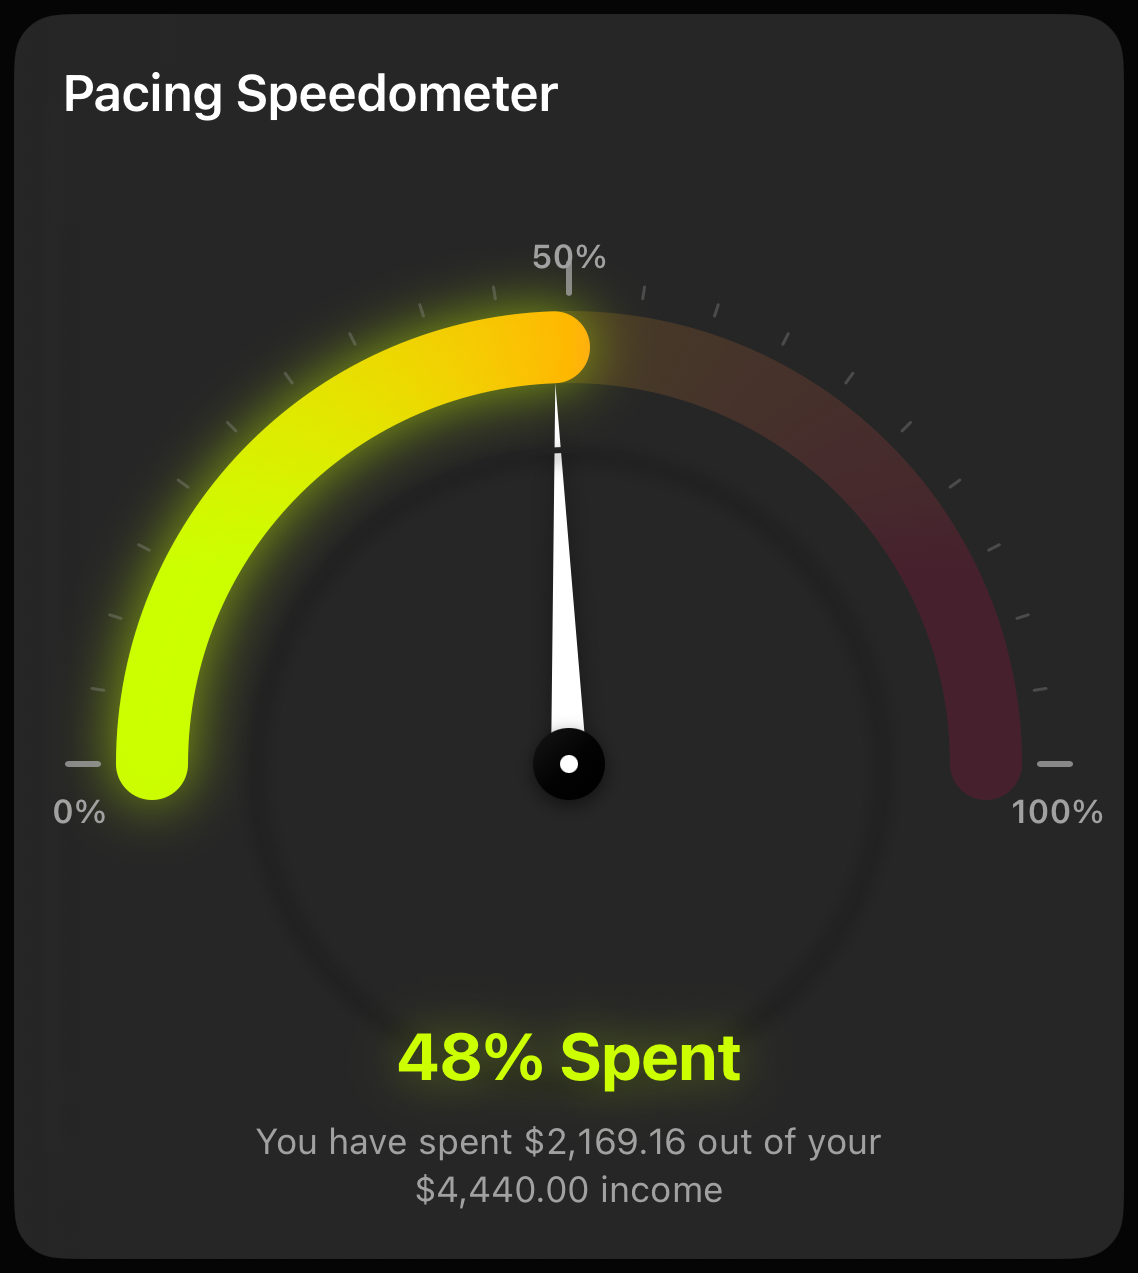
A live burn-rate gauge tells you whether you’re on track — before the month runs out.
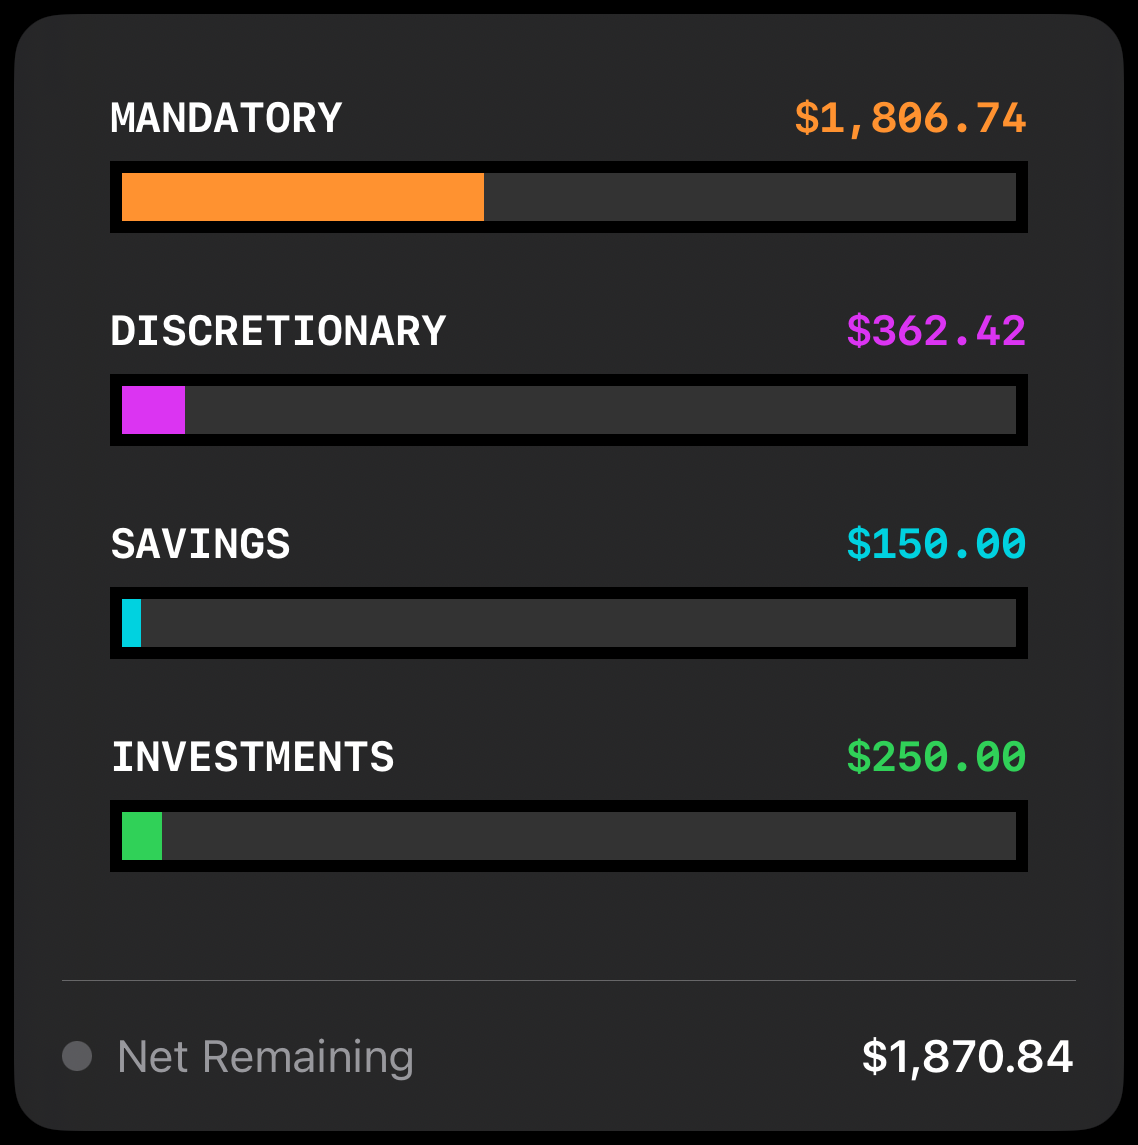
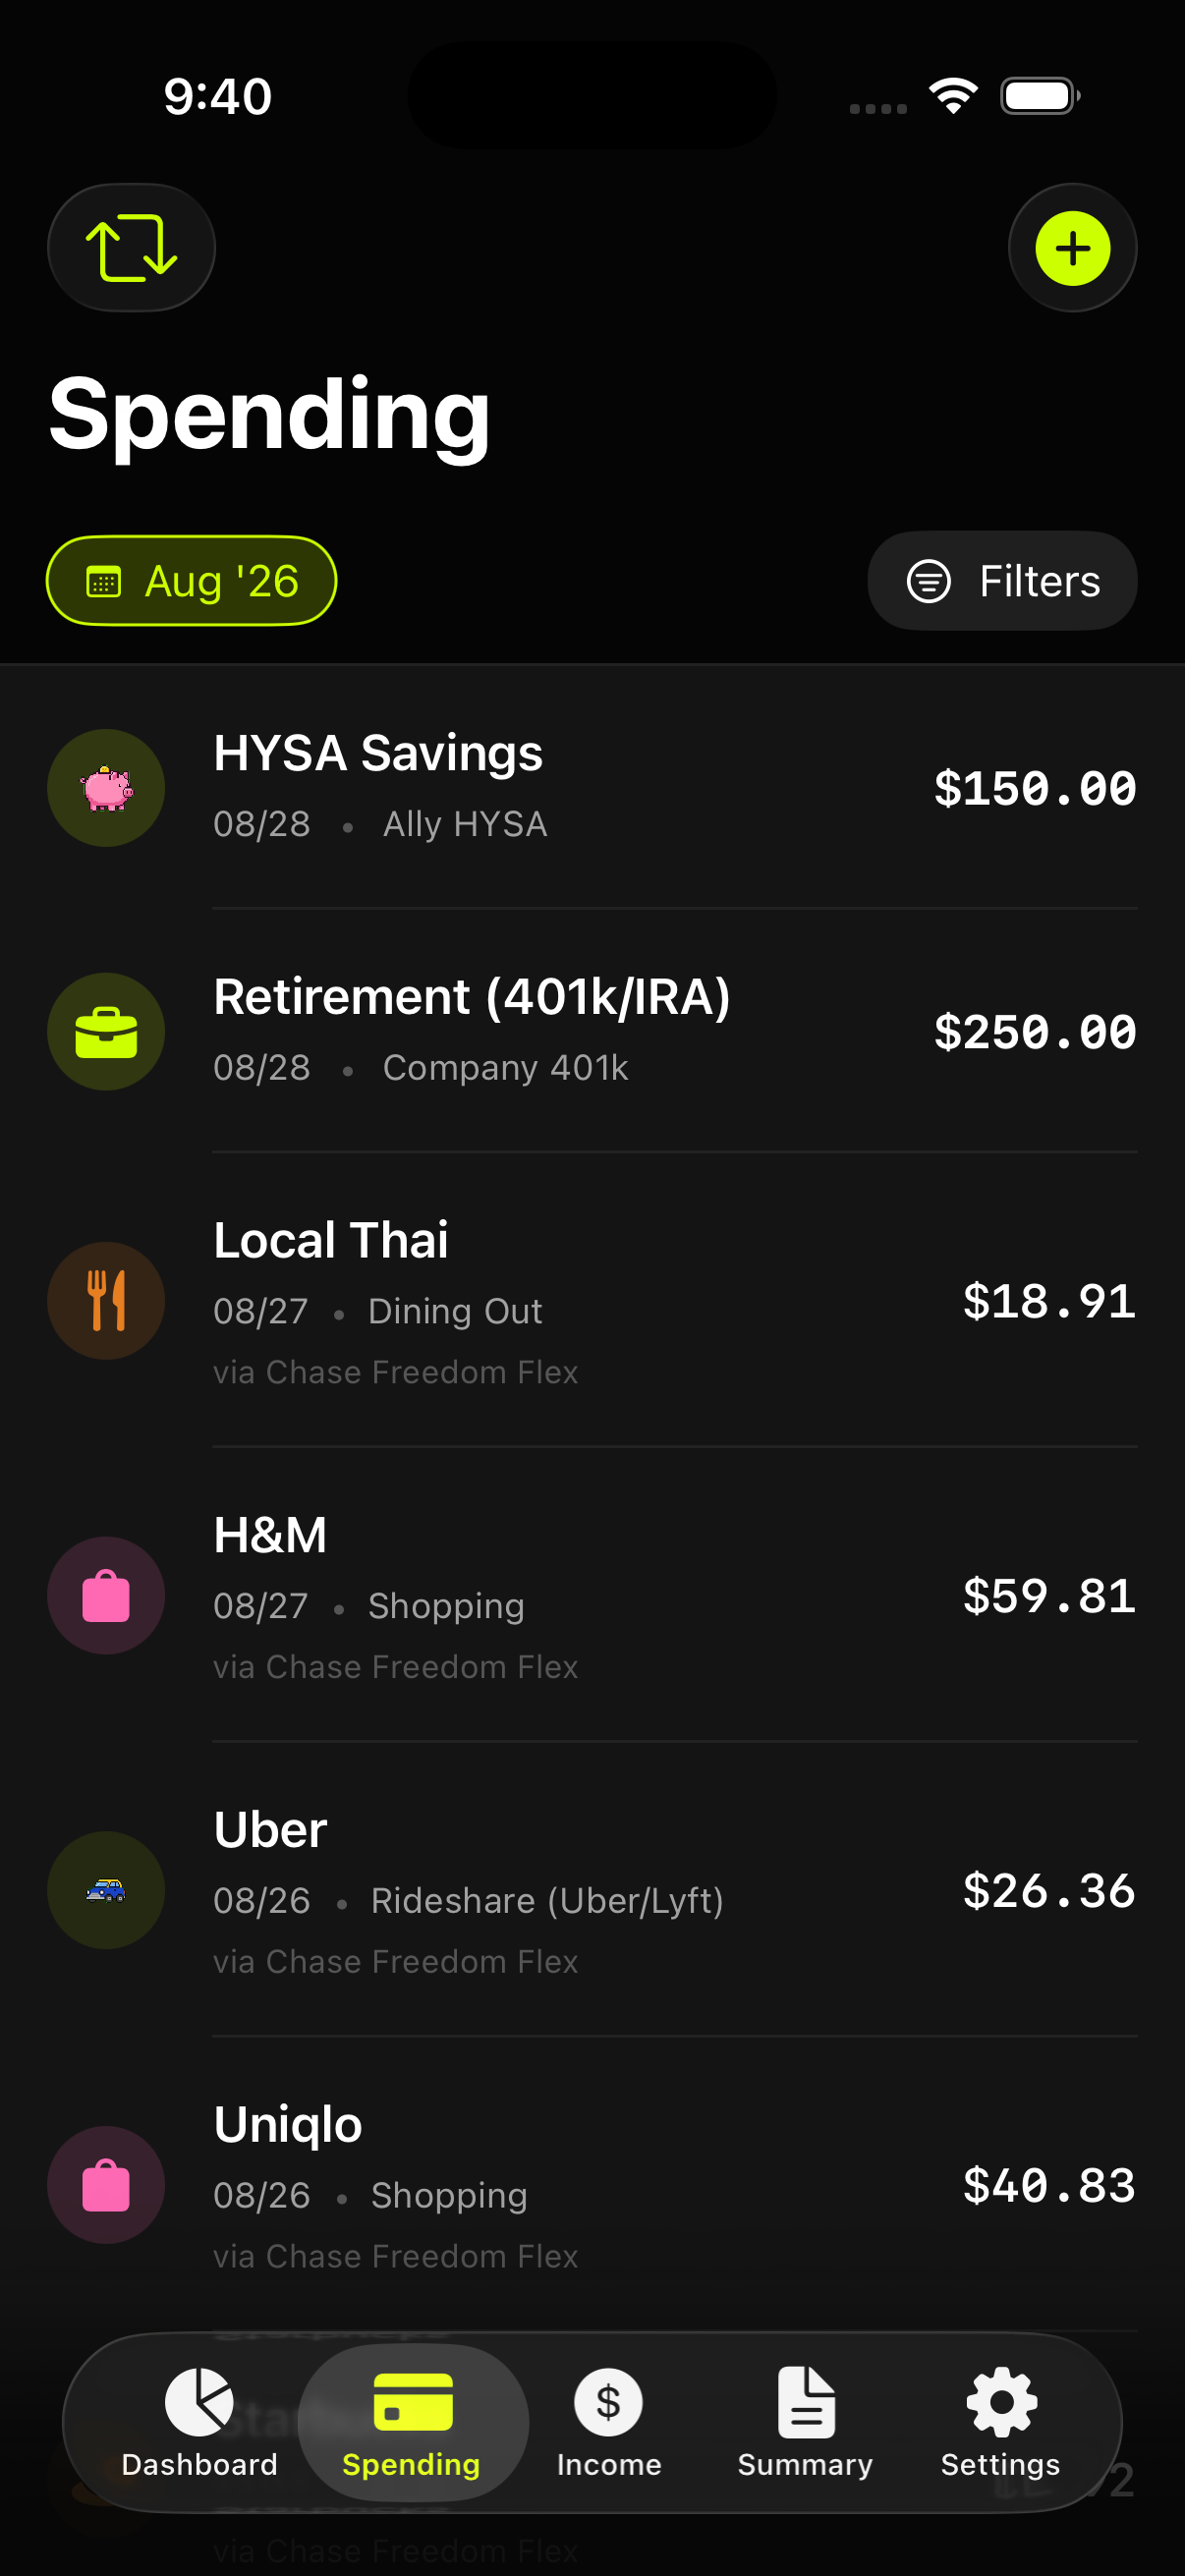
Where the month actually went, ranked — not a pie chart you have to squint at.
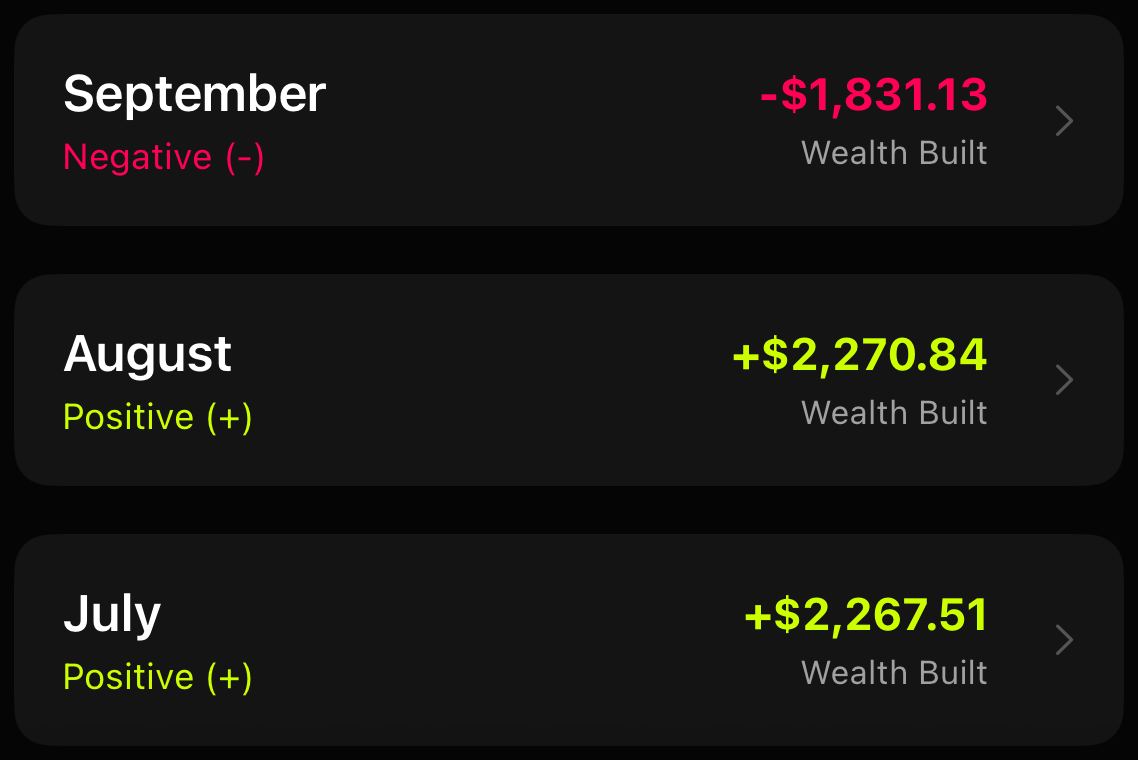
Money moved into savings or investments isn’t spending. WiseMoney counts it as wealth built.
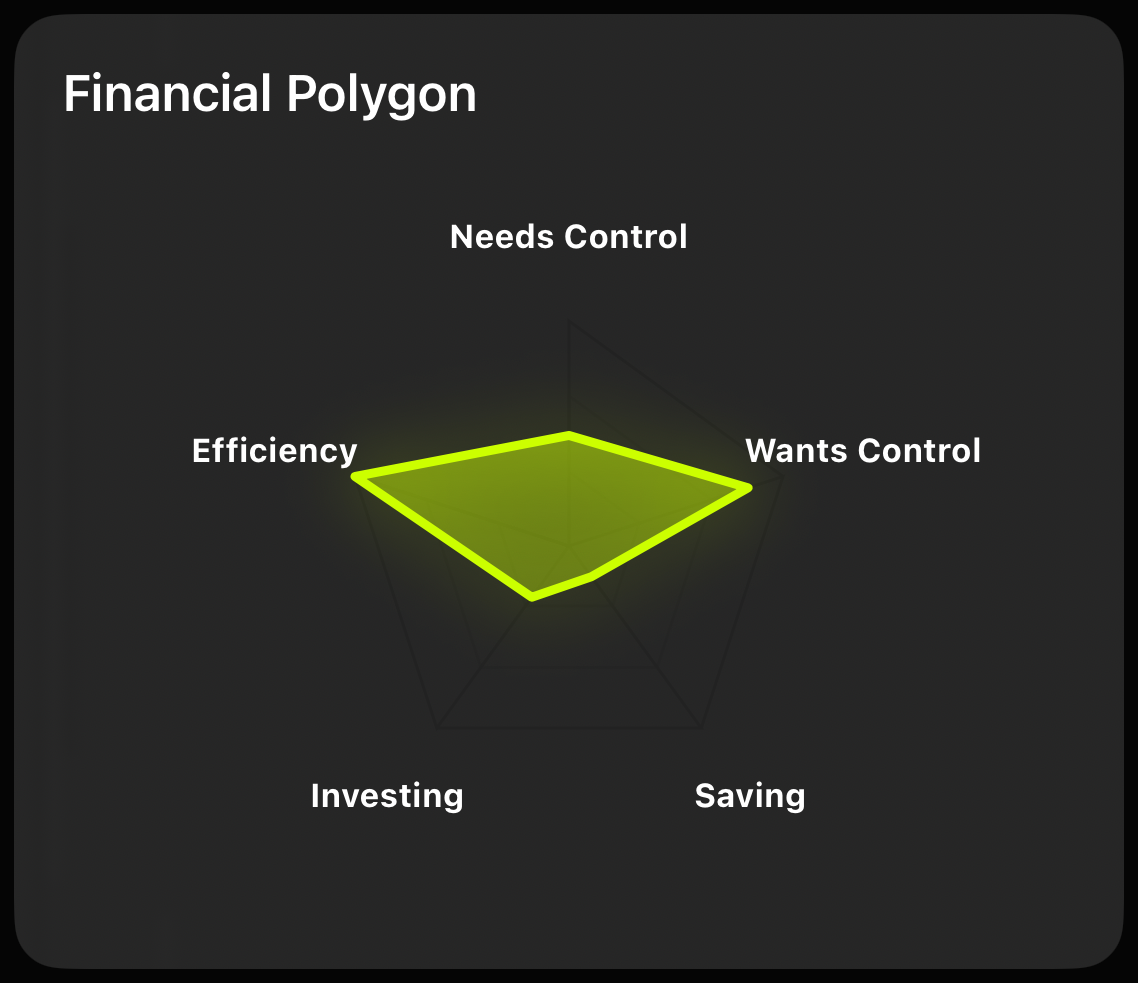
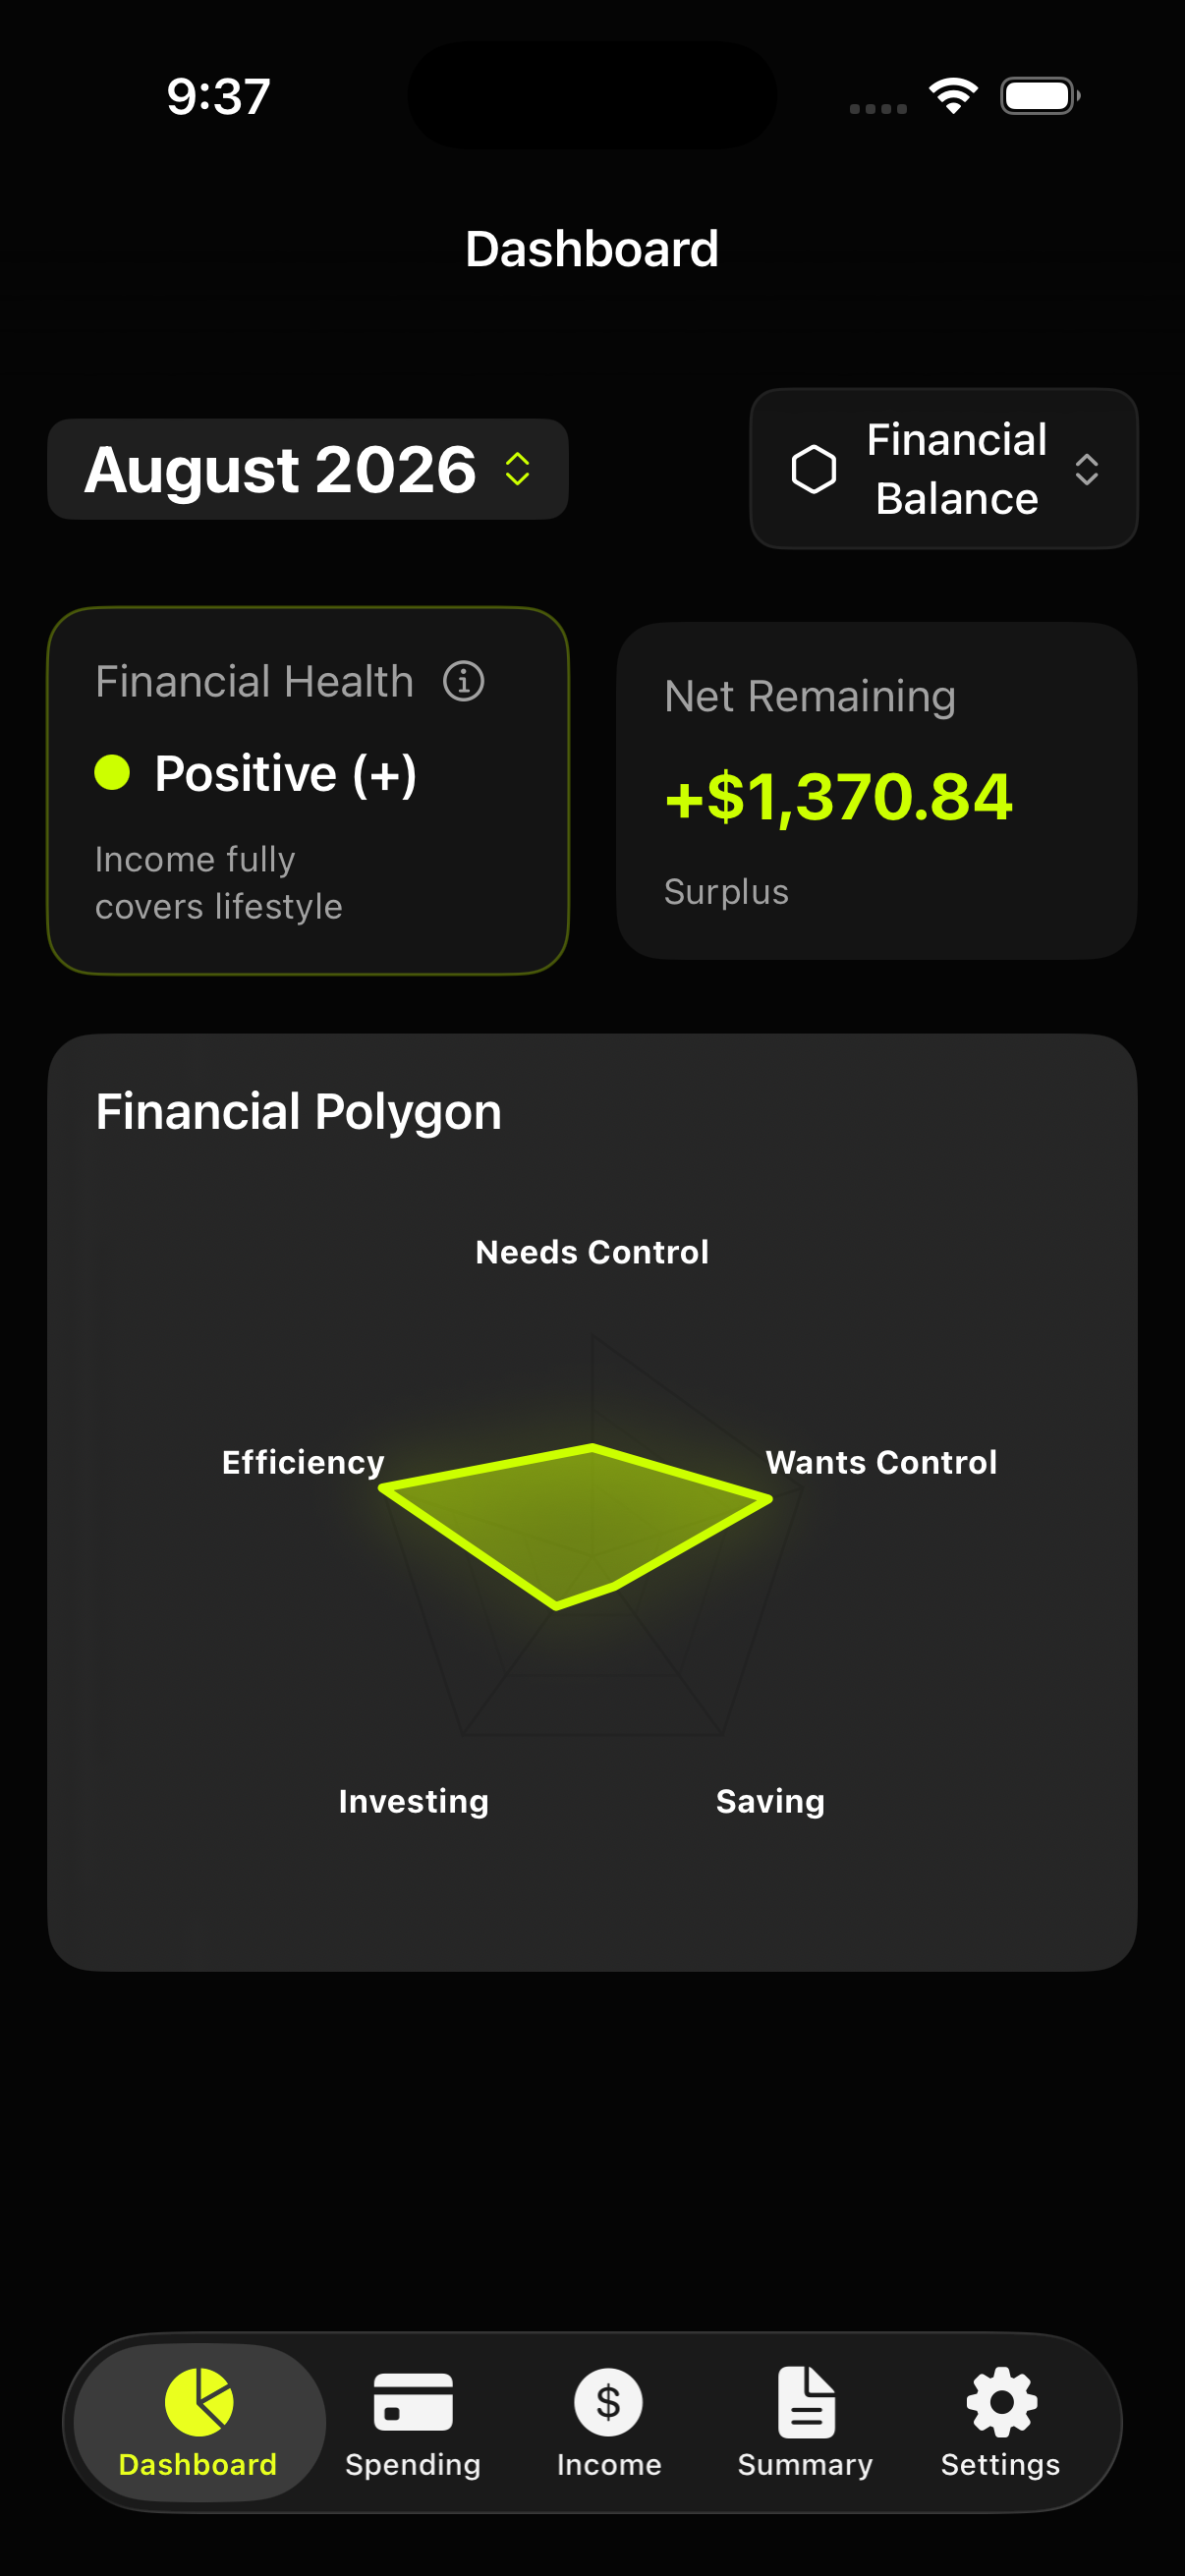
Five dimensions of financial health in one shape. Spot what’s out of balance instantly.
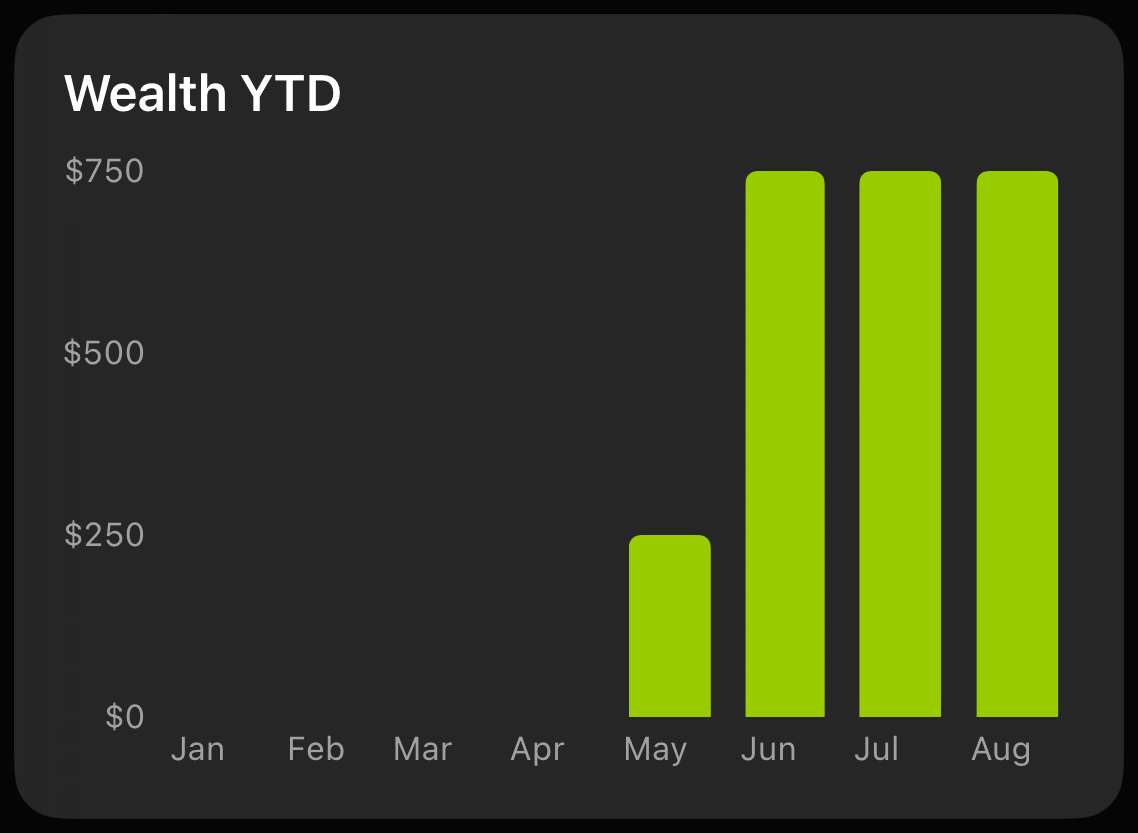
Every contribution to savings and investments, tracked month over month.
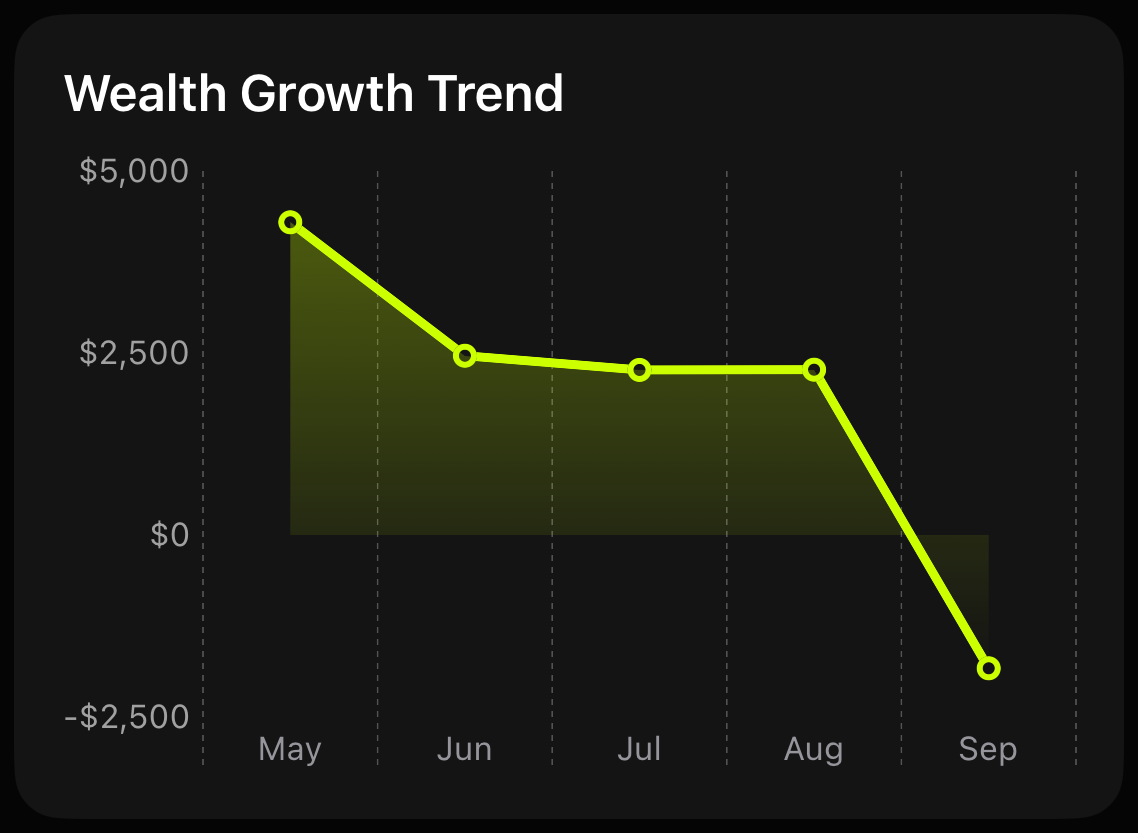
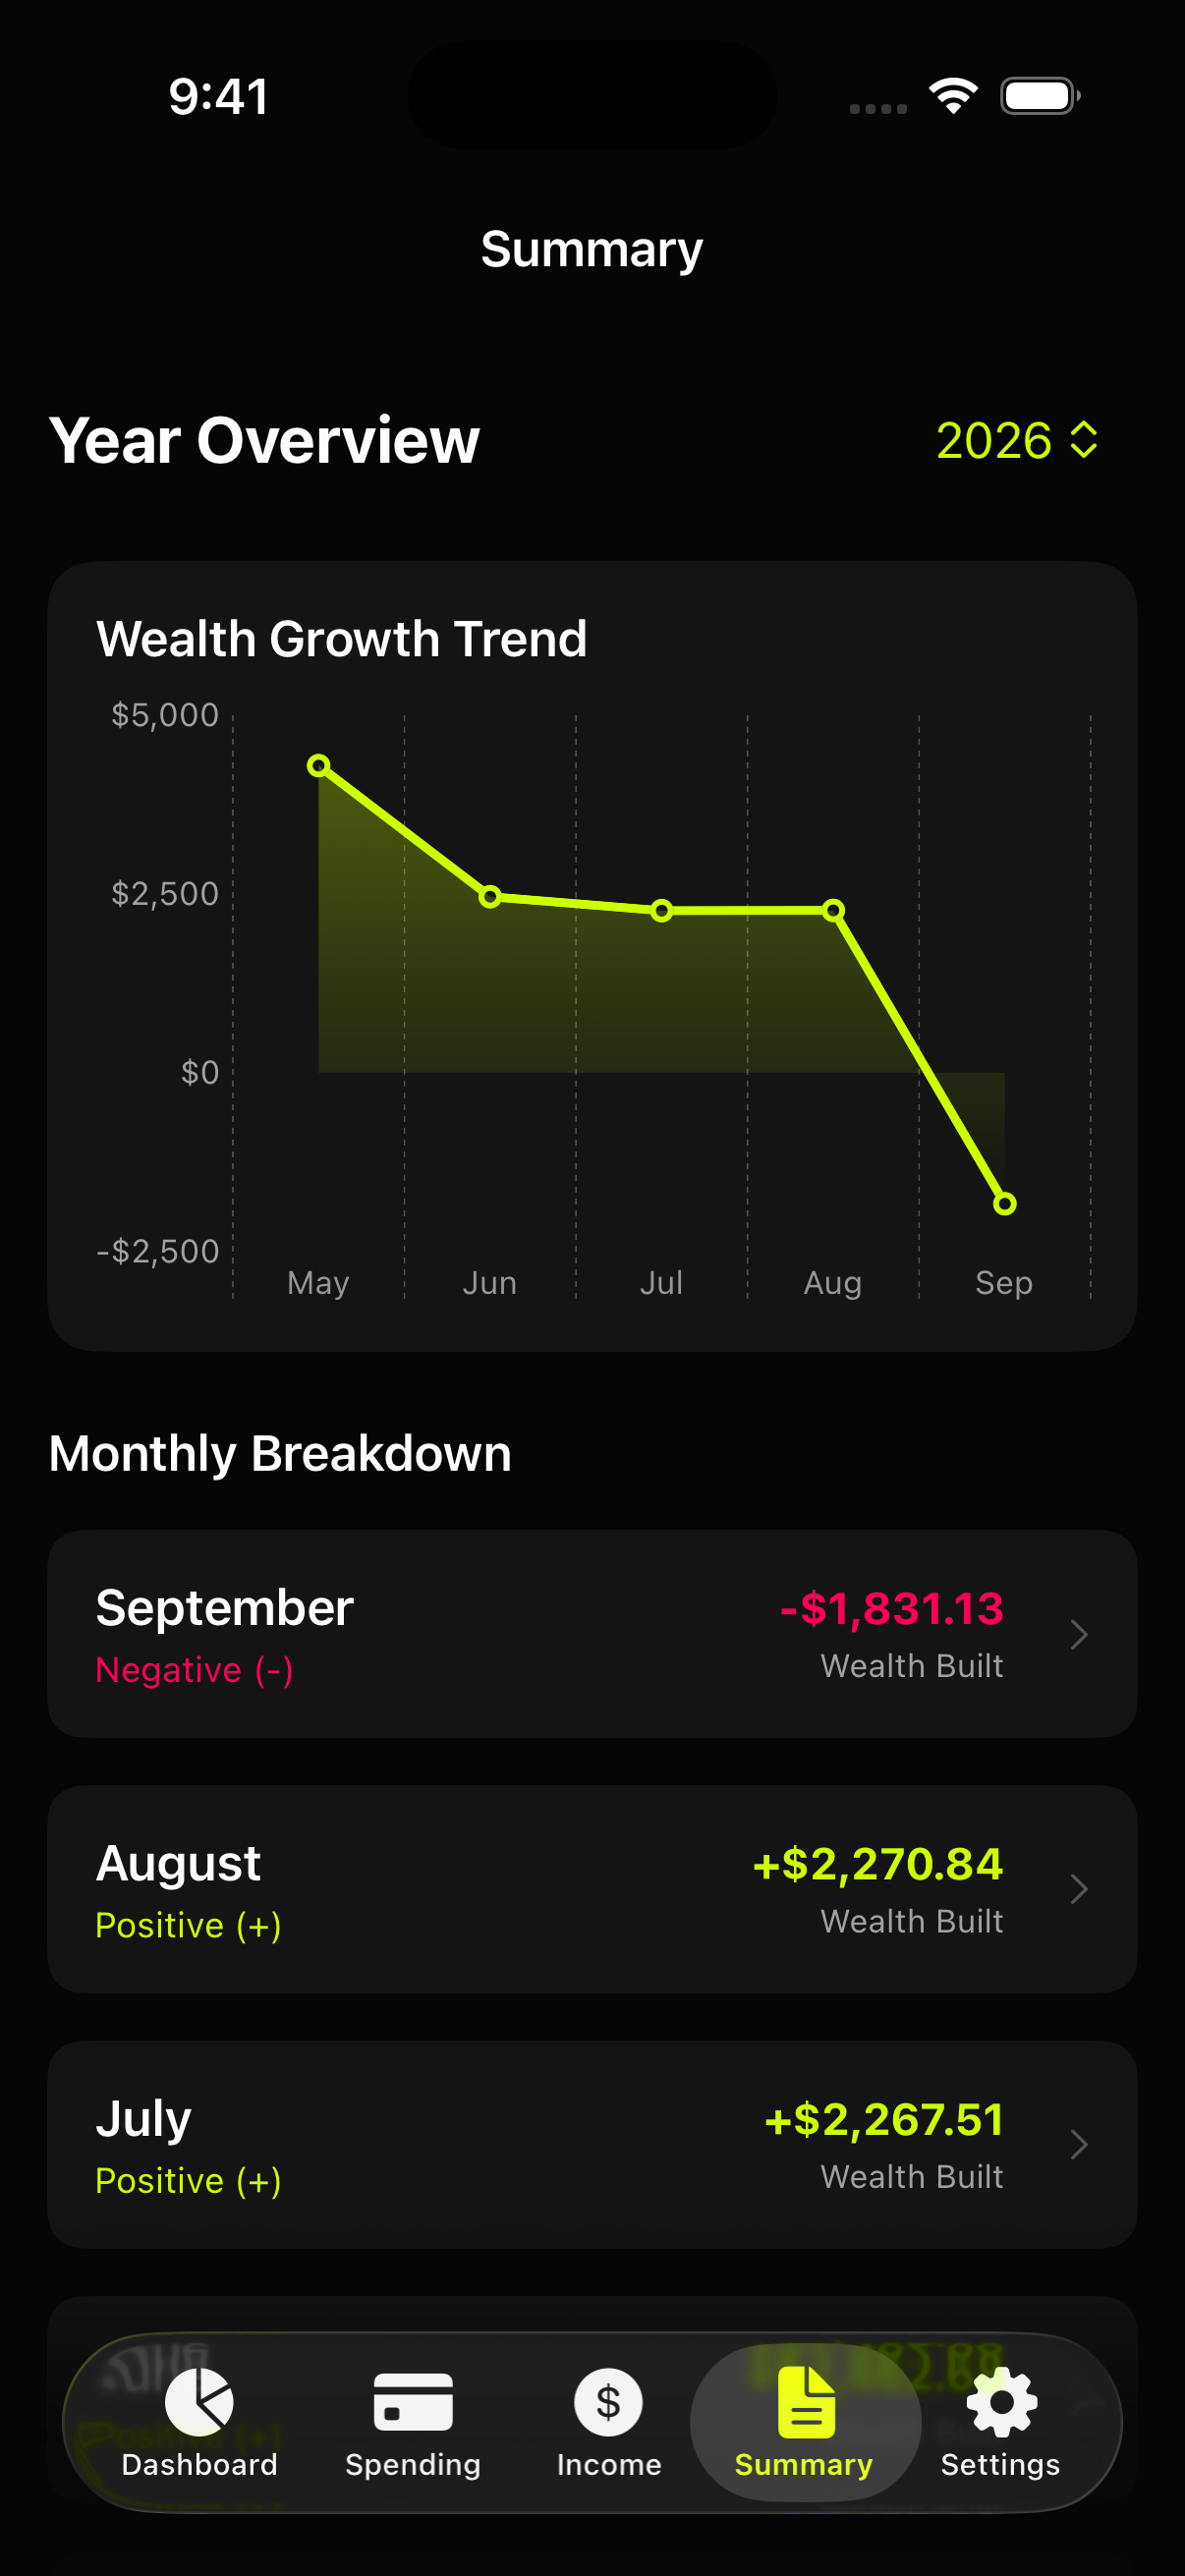
A full year of wealth growth in a single line, so the trend is obvious before the balance is.
Drill into any month to see exactly what you built — or what set you back — then export the whole year as a PDF statement or CSV.
Every calculation happens on your phone. There is no server of ours holding your finances, and nothing for anyone to leak, subpoena, or sell. Four things you can check for yourself:
Learn How We Protect YouNo Plaid, no linked accounts, no read access to anything you own.
Nothing to sign up for. Your ledger is stored locally with SwiftData, on your device only — export a CSV or PDF whenever you want a copy of your own.
No crash logs, no identifiers, no third-party trackers compiled into the app.
A PDF statement or a full CSV export, on demand — and nowhere else.
Let us know what you think of the WiseMoney beta. We read every submission!