
Small spends add up fast
A $6 coffee every workday is about $130 a month. Add two subscriptions you forgot and a few takeout orders, and $300 is gone without one “big” purchase.
NestUp is a money tracker for your phone. Log a purchase in one tap, see what’s left for the month, and get a warning before you overspend. No bank login. Your data never leaves your phone.
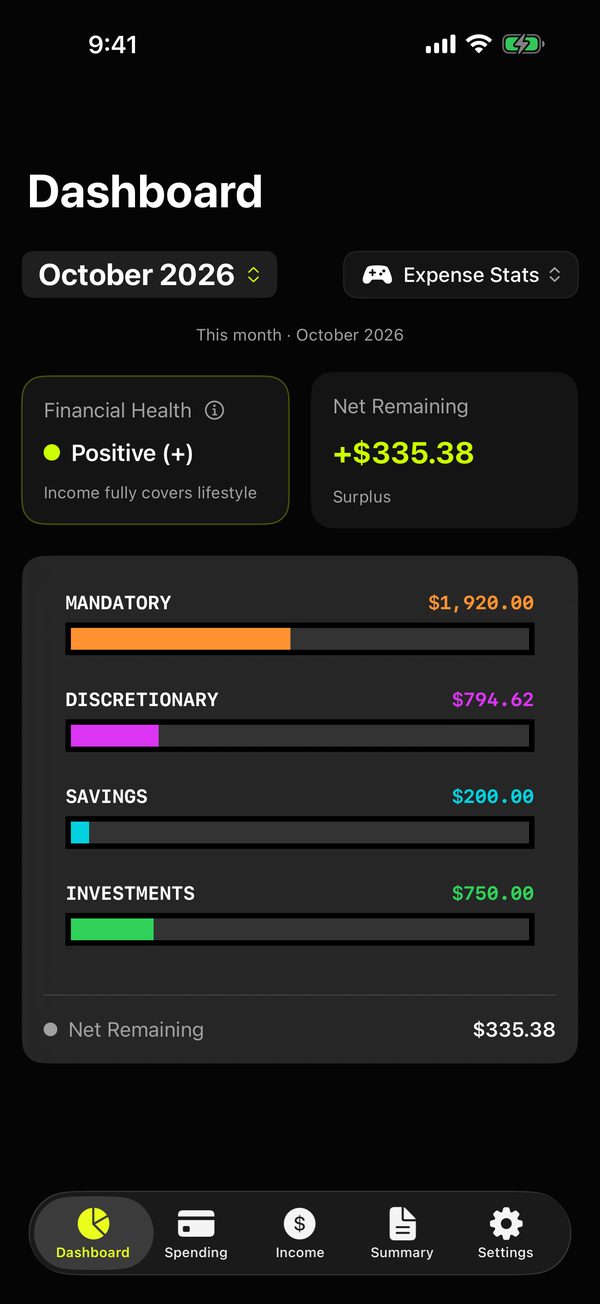
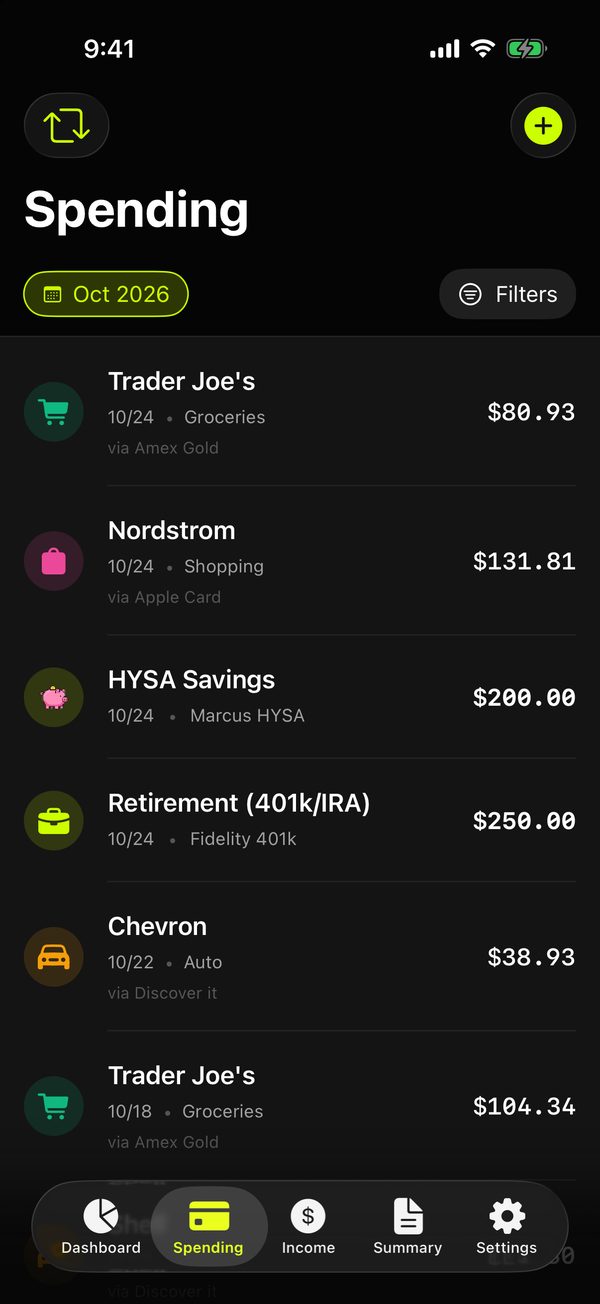


DashboardThe month at a glance: what came in, what went out, what is left.
Money rarely disappears in one big purchase. It leaks out in small ones you’ve forgotten by Friday.
A $6 coffee every workday is about $130 a month. Add two subscriptions you forgot and a few takeout orders, and $300 is gone without one “big” purchase.
A balance can’t tell you if you’ll make it to payday. It can’t tell you what tax took from your check, or whether this month beat the last one.
Most of them link to your bank and copy every transaction to their servers. A spreadsheet keeps things private, but you type it all yourself. Most people give up.
Open NestUp and you’ll know, at any moment:
No bank to link. No spreadsheet. No formulas.
Your paycheck, your bills, your accounts. After that, rent and subscriptions log themselves every month.
Tap the widget on your Home Screen, or say “Log an expense in NestUp.” On payday, type two numbers: gross and net.
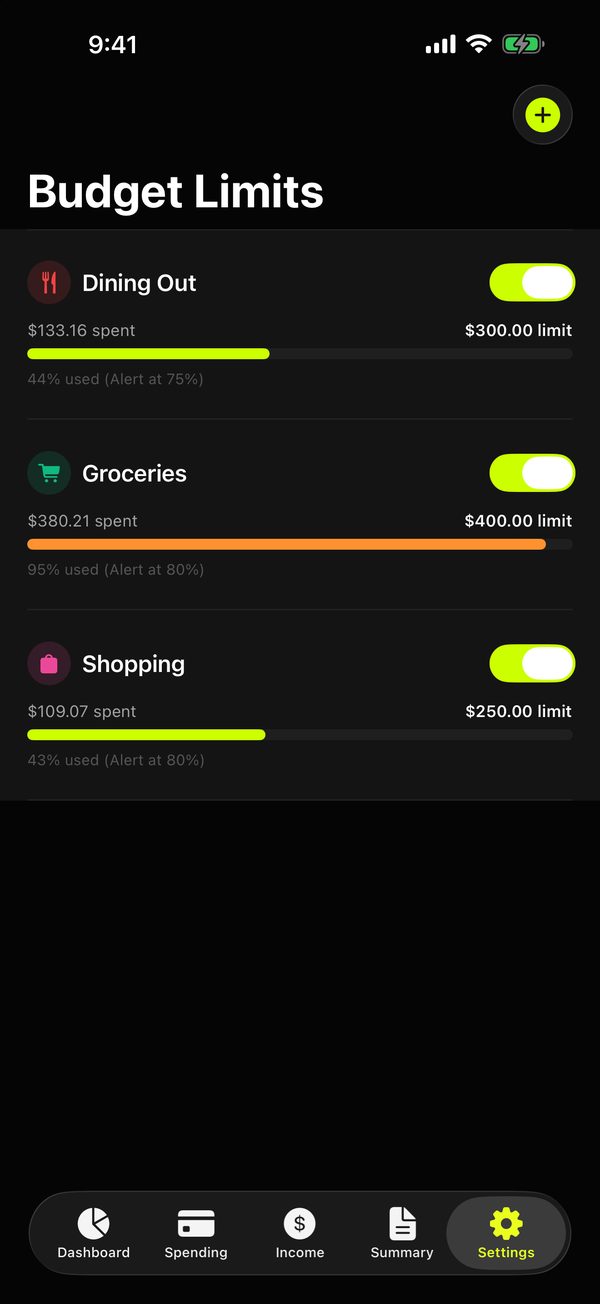
NestUp pings you when a budget gets close to its limit, and again if you go past it. At month end, it tells you in plain words where the money went.
Every image below is the real app. No mockups.
Most money apps assume one salary landing in one account. NestUp assumes the opposite.
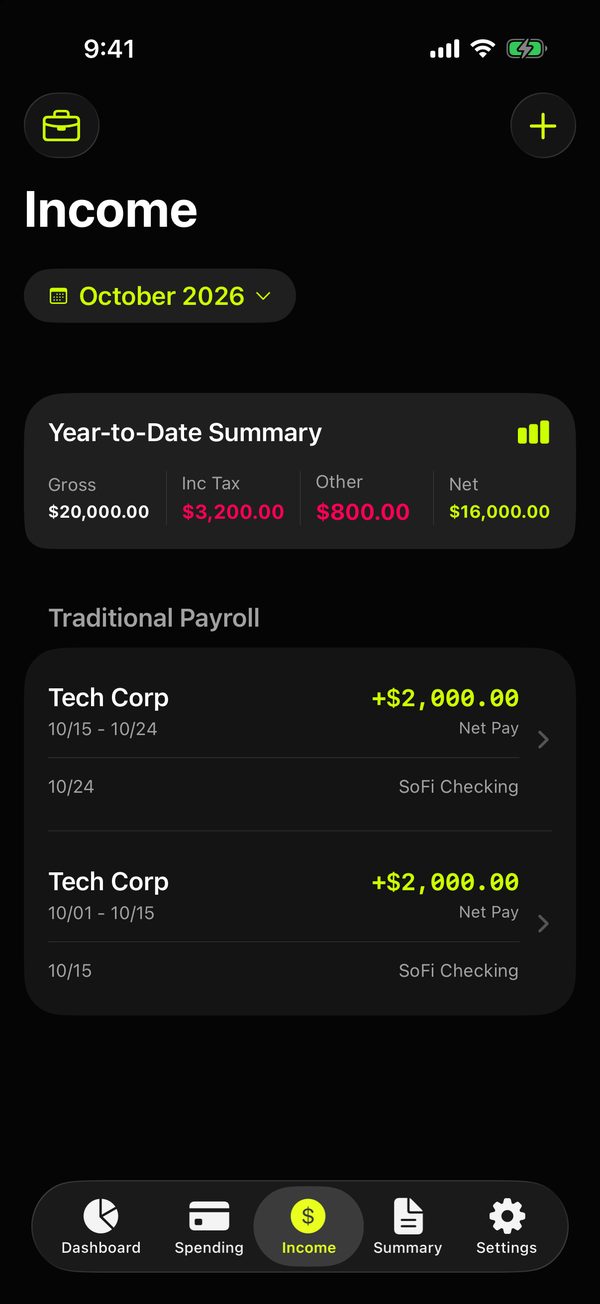
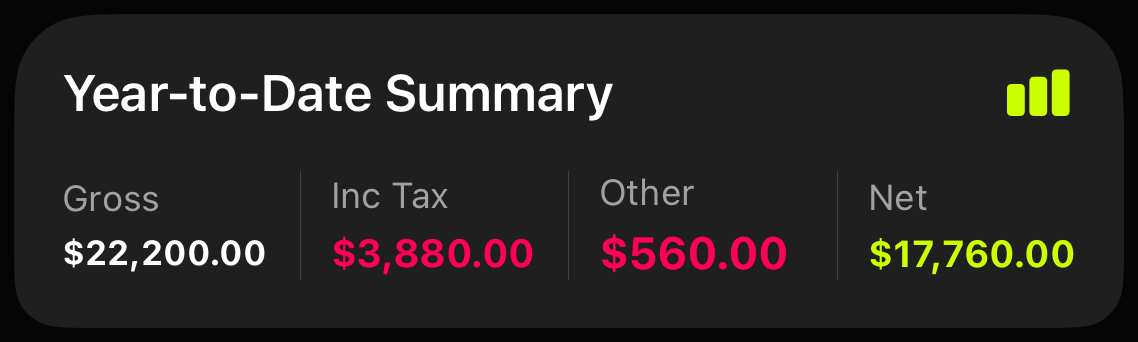
Give each job its own profile and NestUp keeps year-to-date gross, tax, deductions, and true take-home separate for each one. A day job and freelance work sit side by side instead of being averaged into a single misleading number.
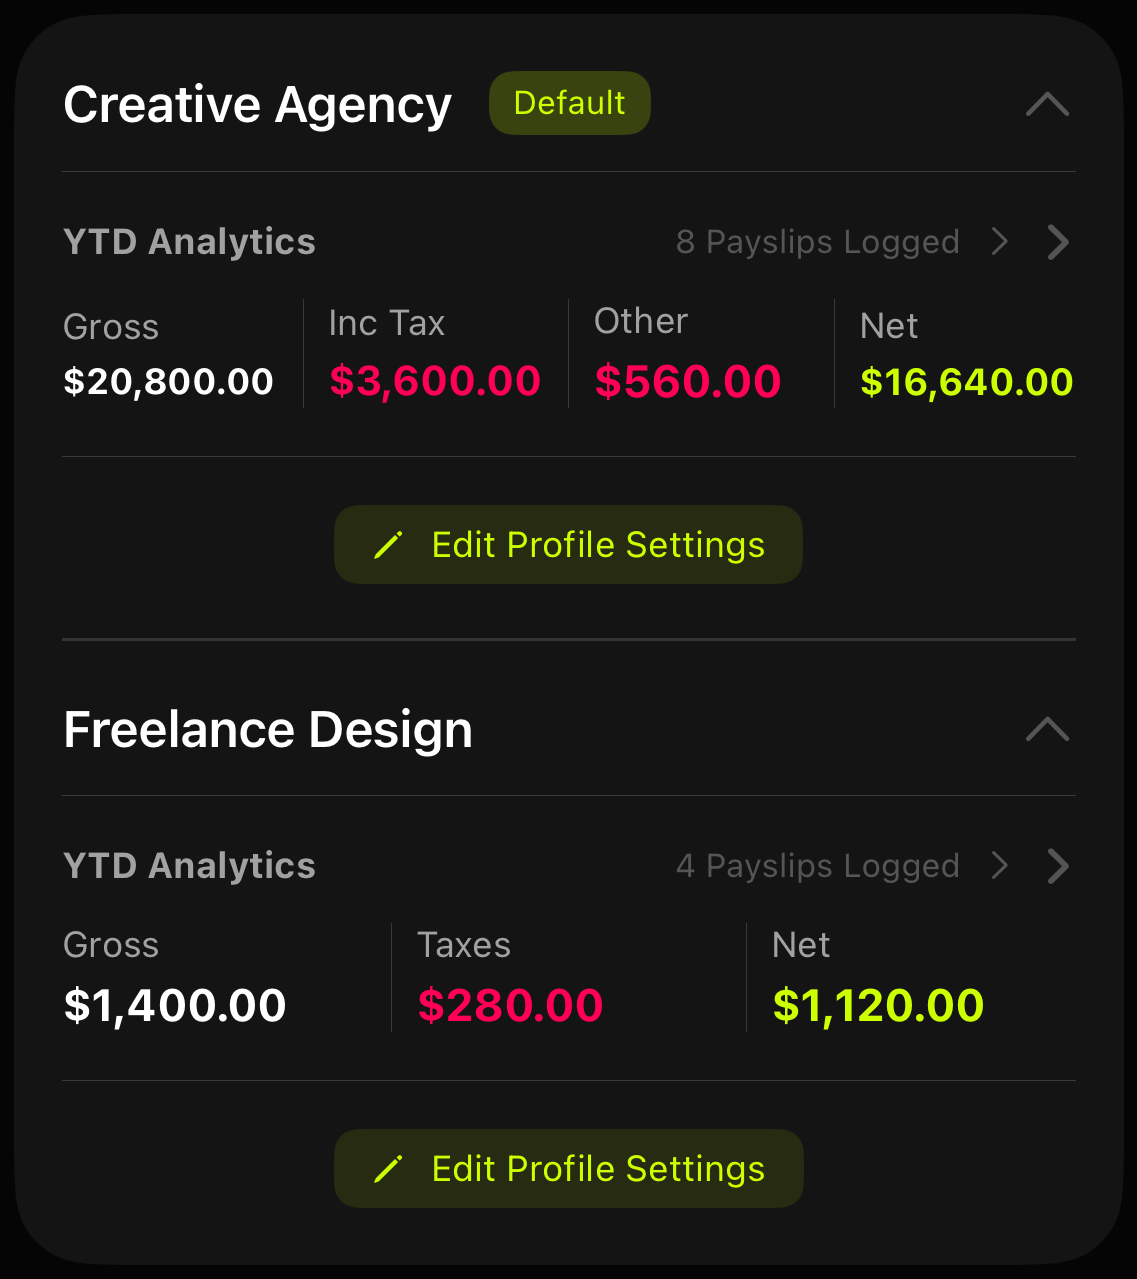
Enter one typical paystub: gross, net, income tax and deductions. NestUp learns how that employer splits your pay. After that, each payslip needs only gross and net. NestUp estimates the rest, so you can see roughly what went to tax and what went to your 401(k) and insurance instead of watching one number land in your account.
Estimates, not filings. The split is modelled from the paystub you gave it.
Every purchase sorted into needs, wants, savings and investing, so you can see what was essential and what wasn’t.
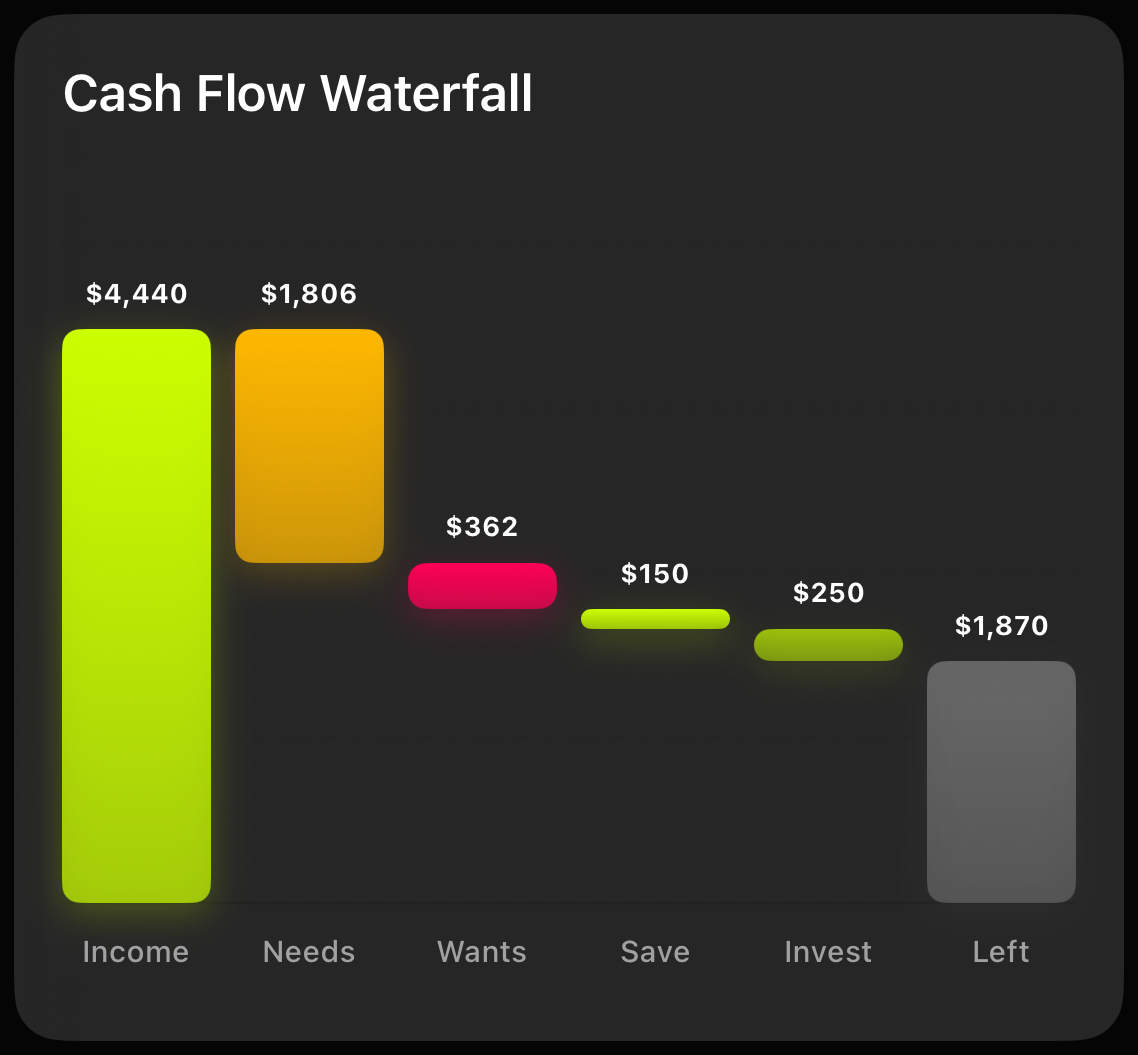
The Cash Flow Waterfall shows exactly where your income lands: needs, wants, savings and investments. The last bar is what’s left. One chart replaces the spreadsheet.
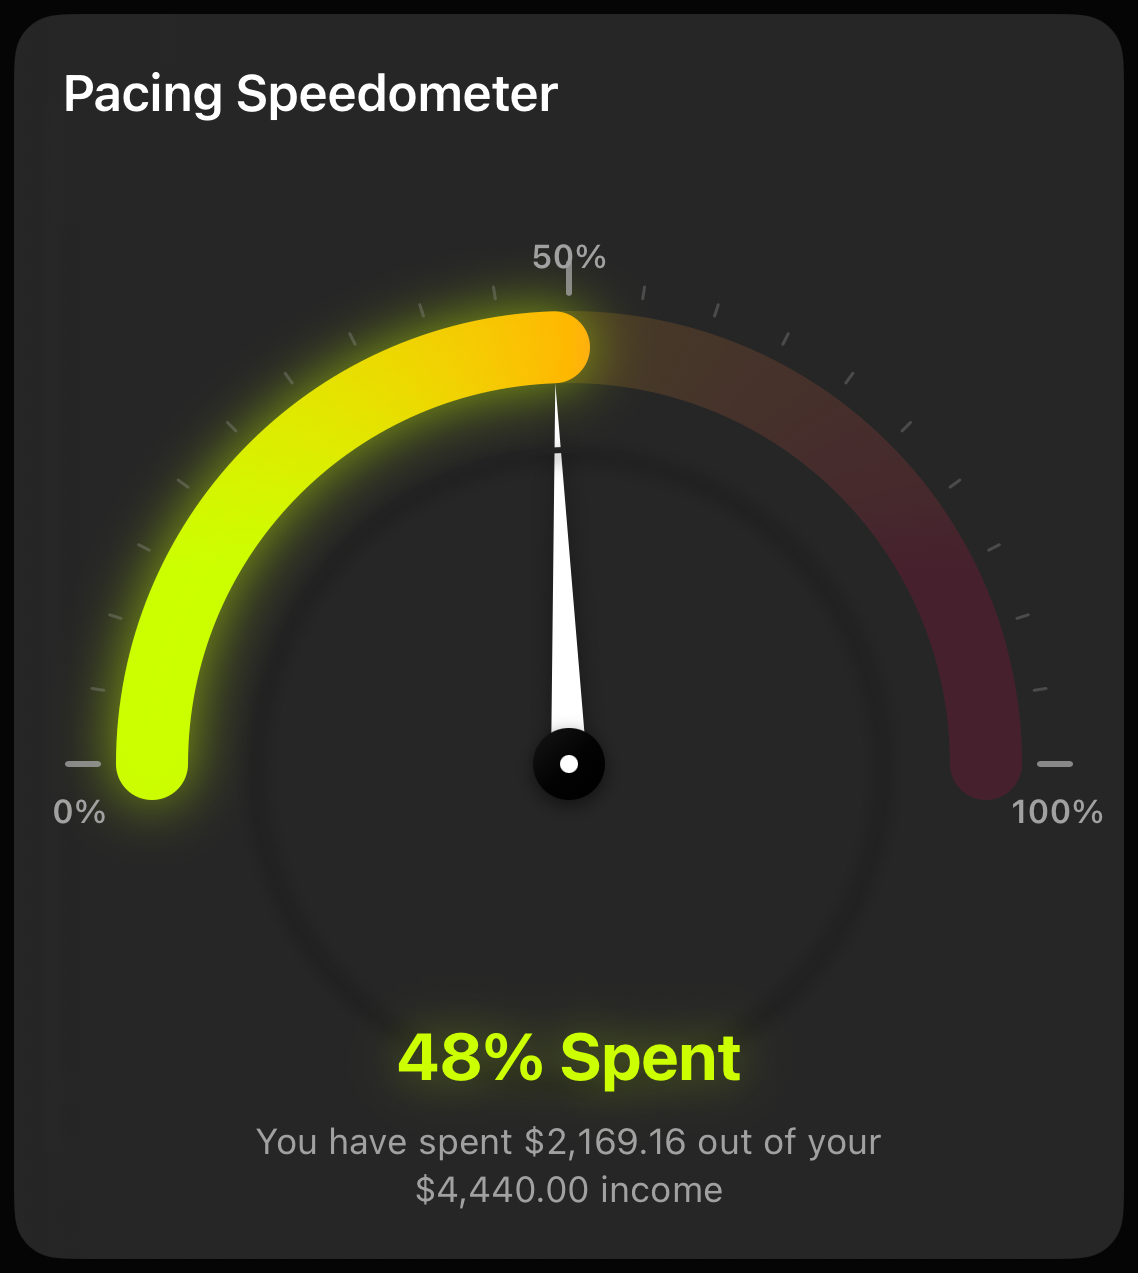
A live burn-rate gauge tells you whether you’re on track while there’s still month left.
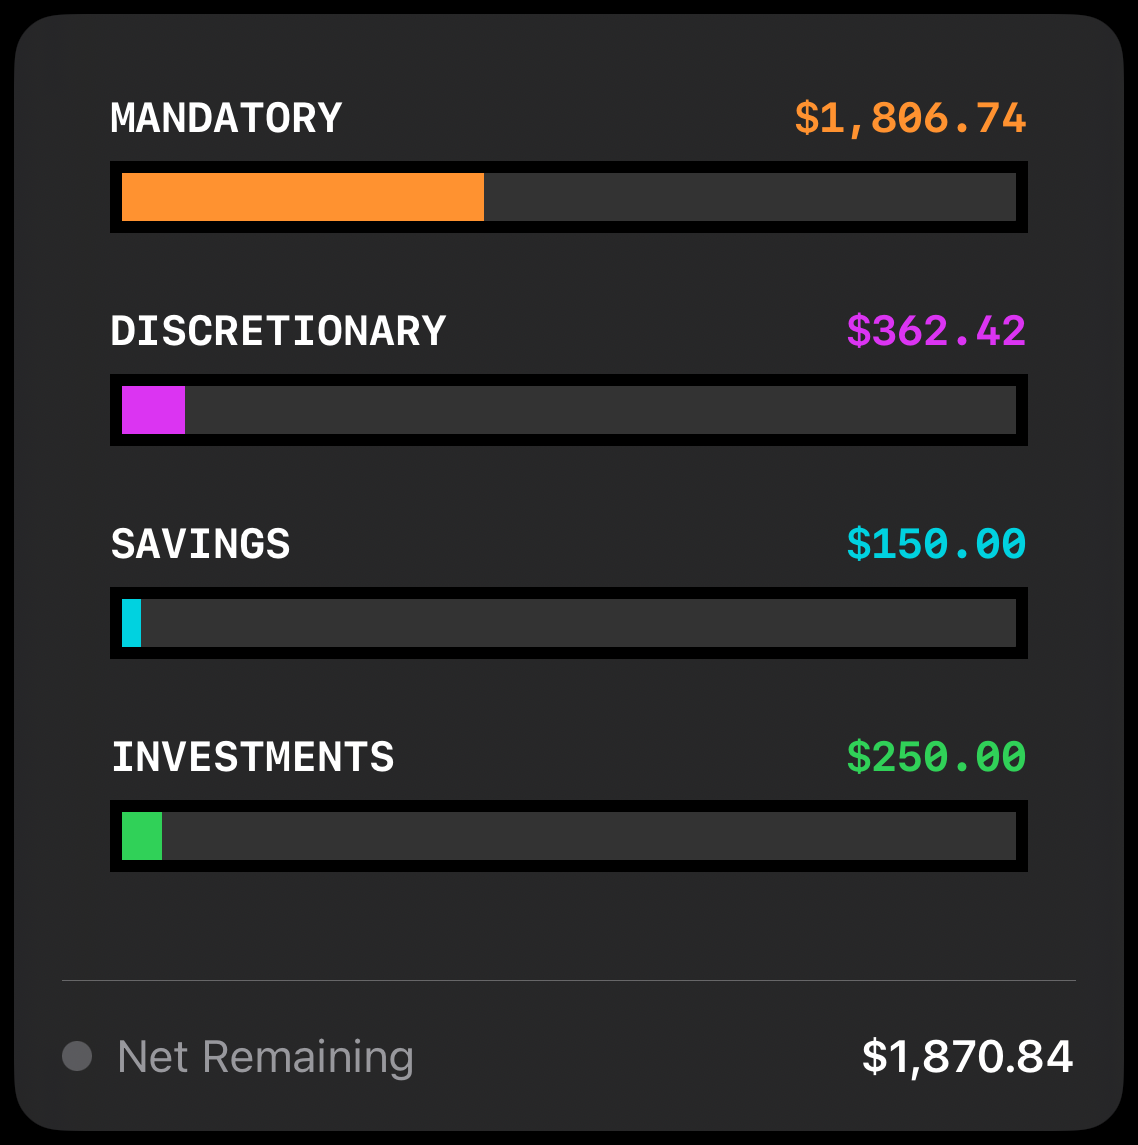
Where the month actually went, biggest first.
Money moved into savings or investments isn’t spending. NestUp counts it as wealth built.
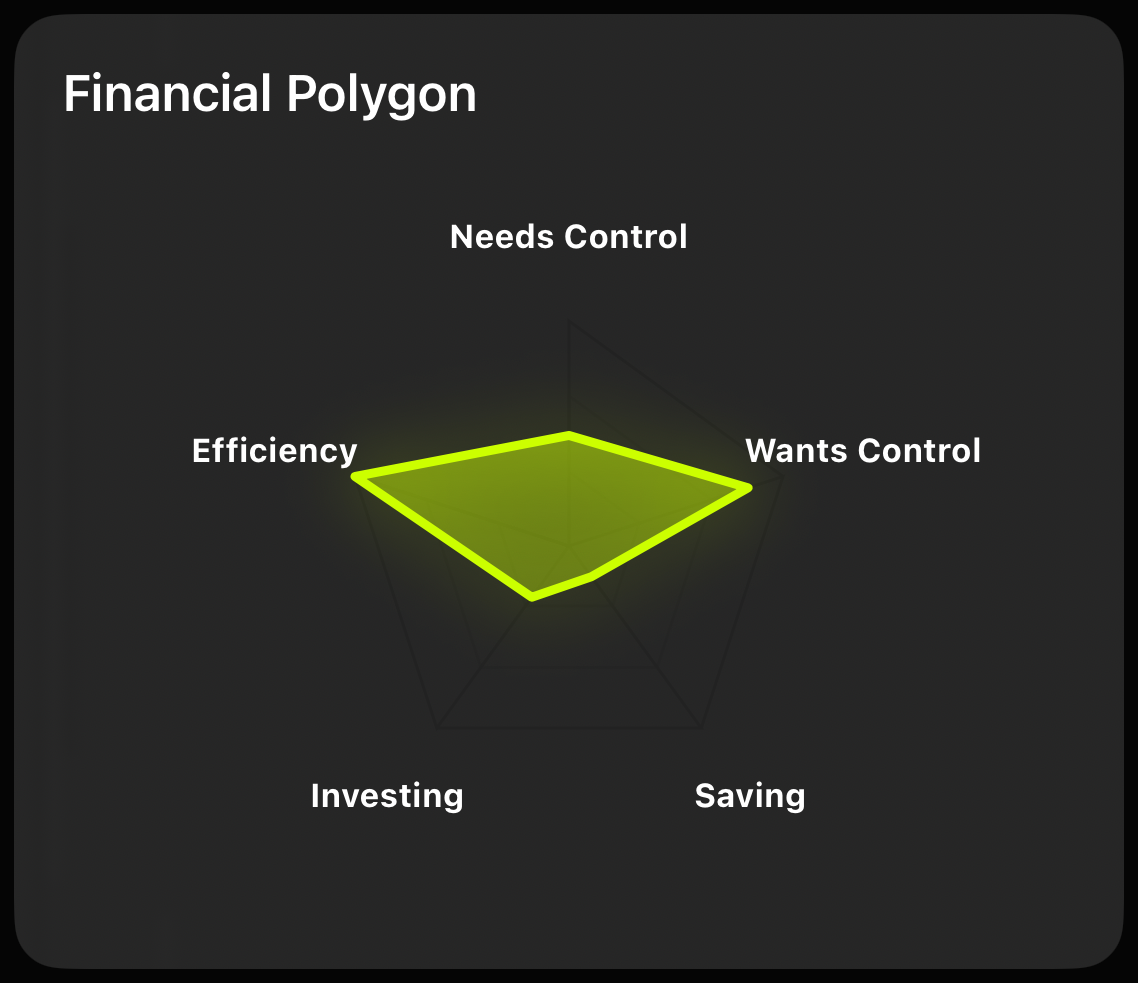
Five dimensions of financial health in one shape. Spot what’s out of balance instantly.
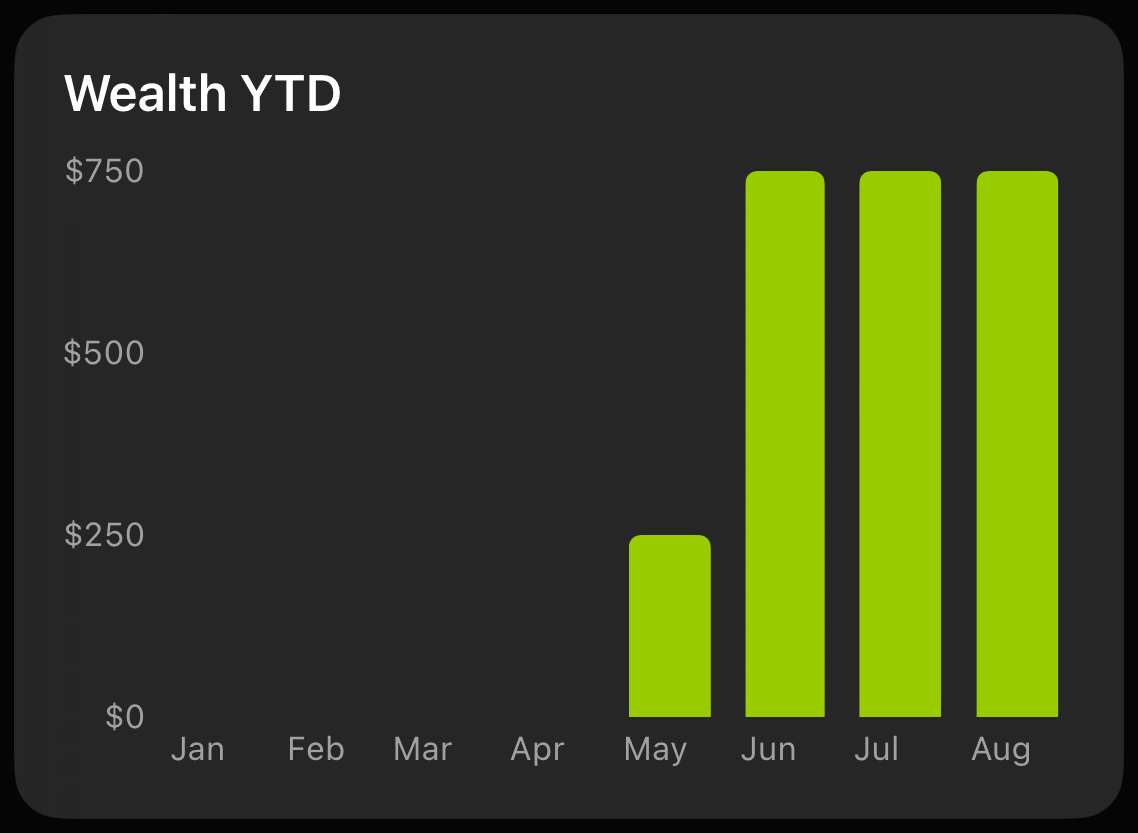
Every contribution to savings and investments, tracked month over month.
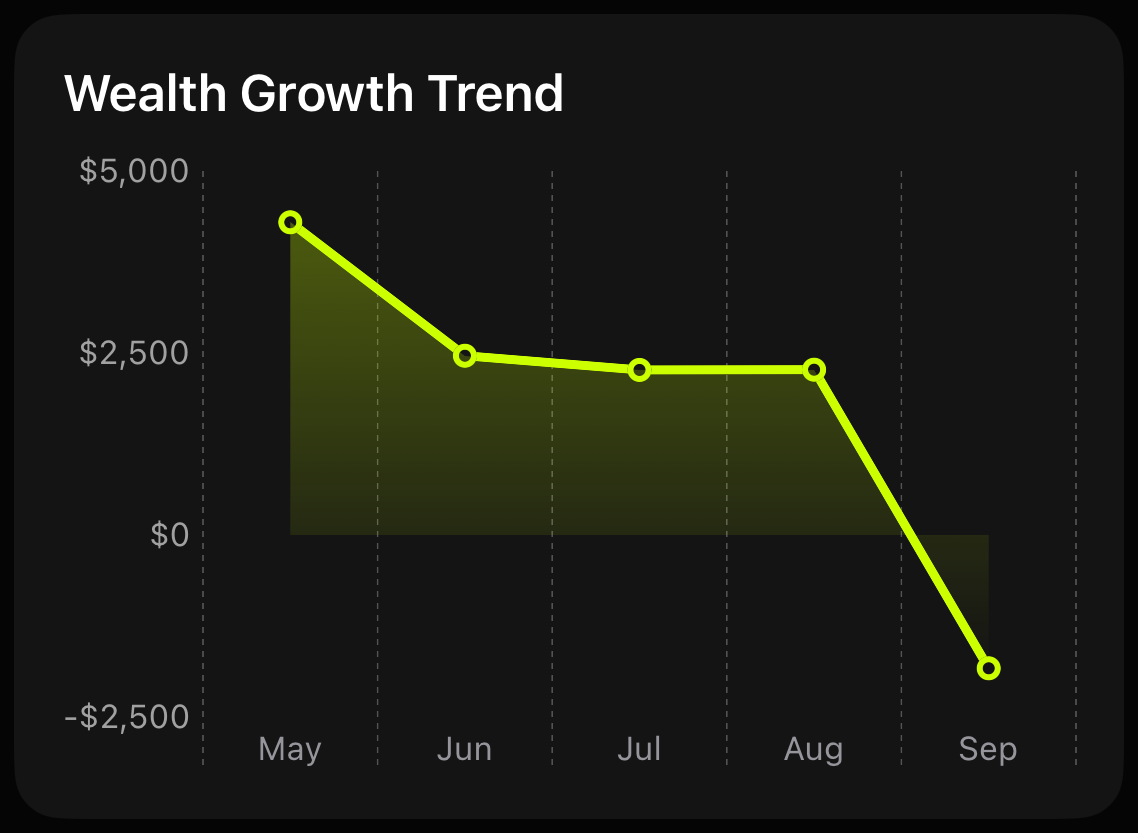
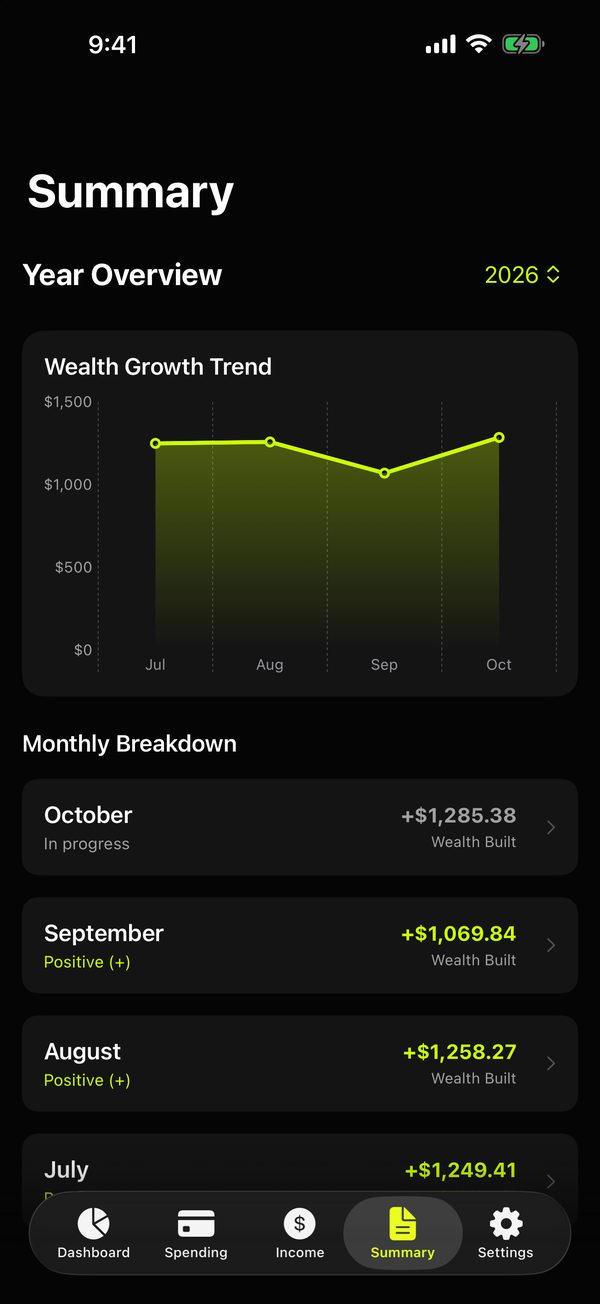
A full year of wealth growth in a single line, so the trend is obvious before the balance is.
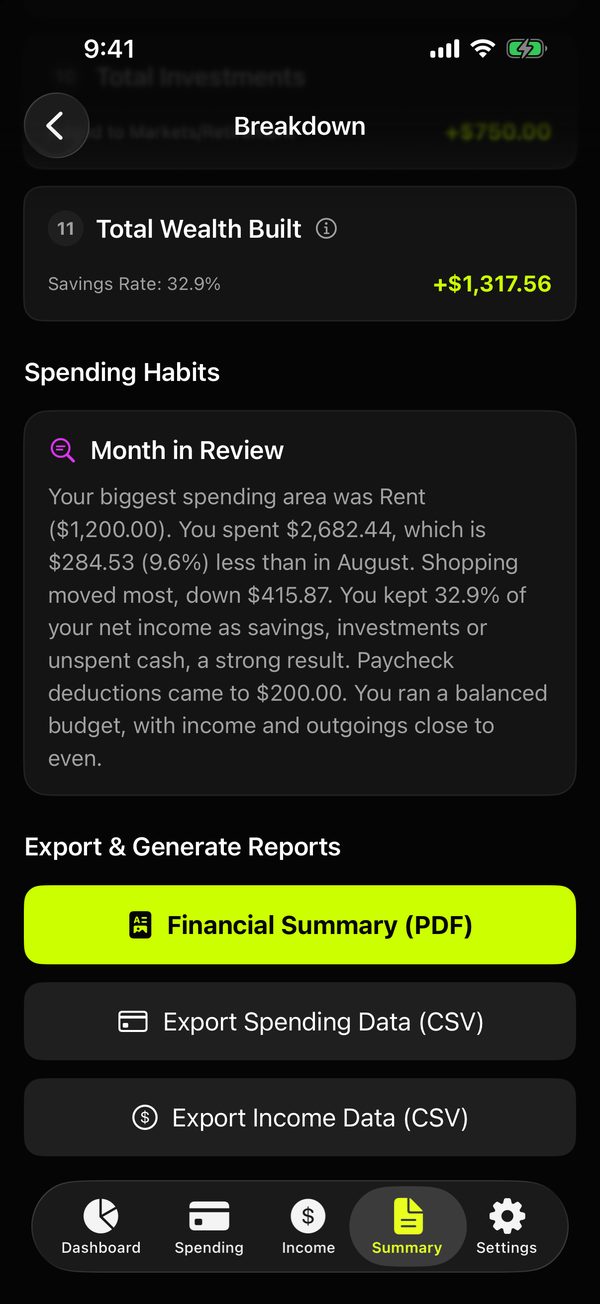
Drill into any month to see what you built and what set you back. Then export the whole year as a PDF statement or CSV.
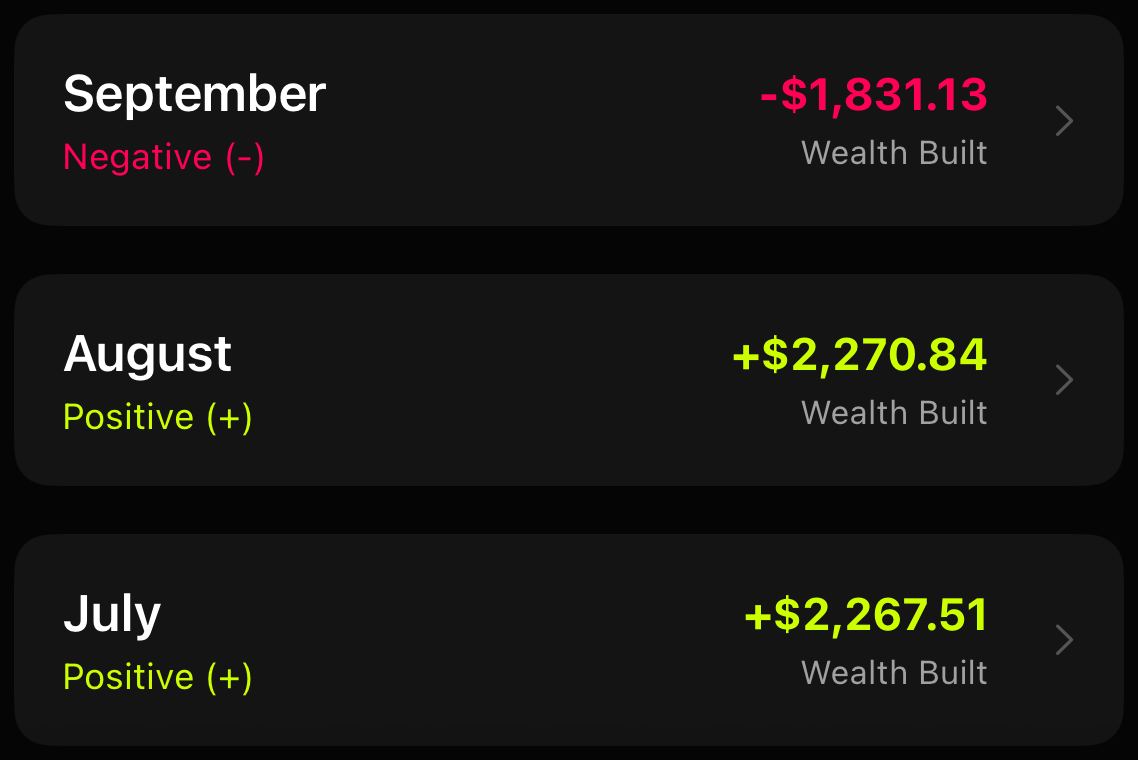
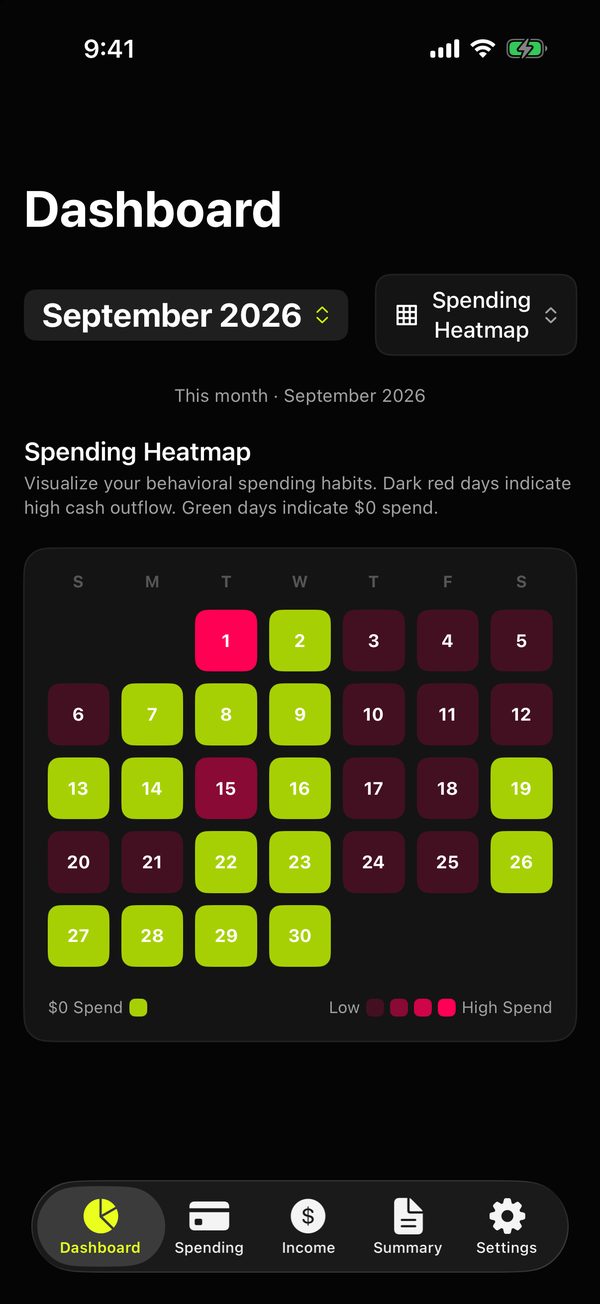
See spending day by day, read a plain-English review of every finished month, and get a heads-up before a budget runs out.
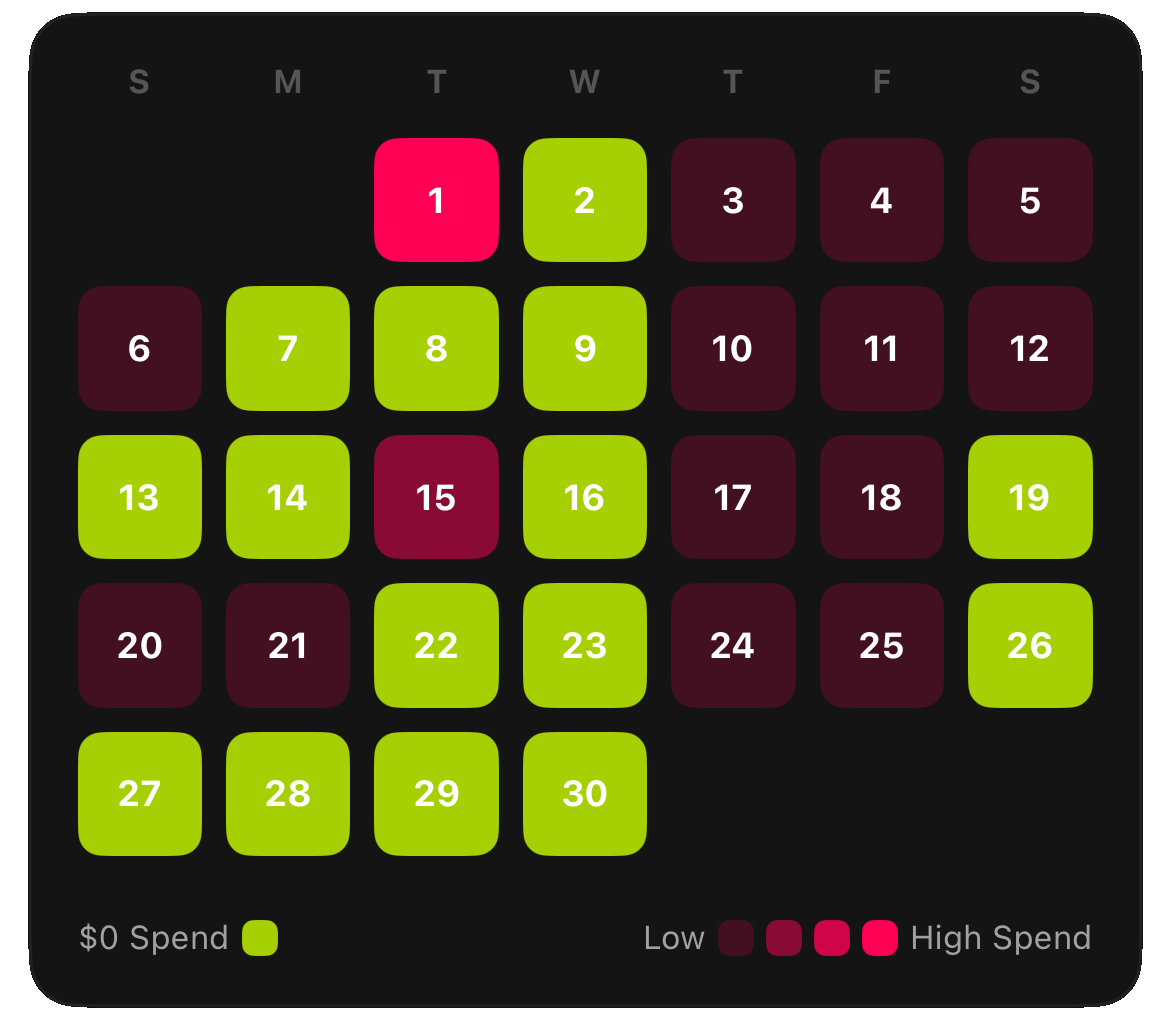
Every day of the month, shaded by how much went out. Tap a day to see what it was.
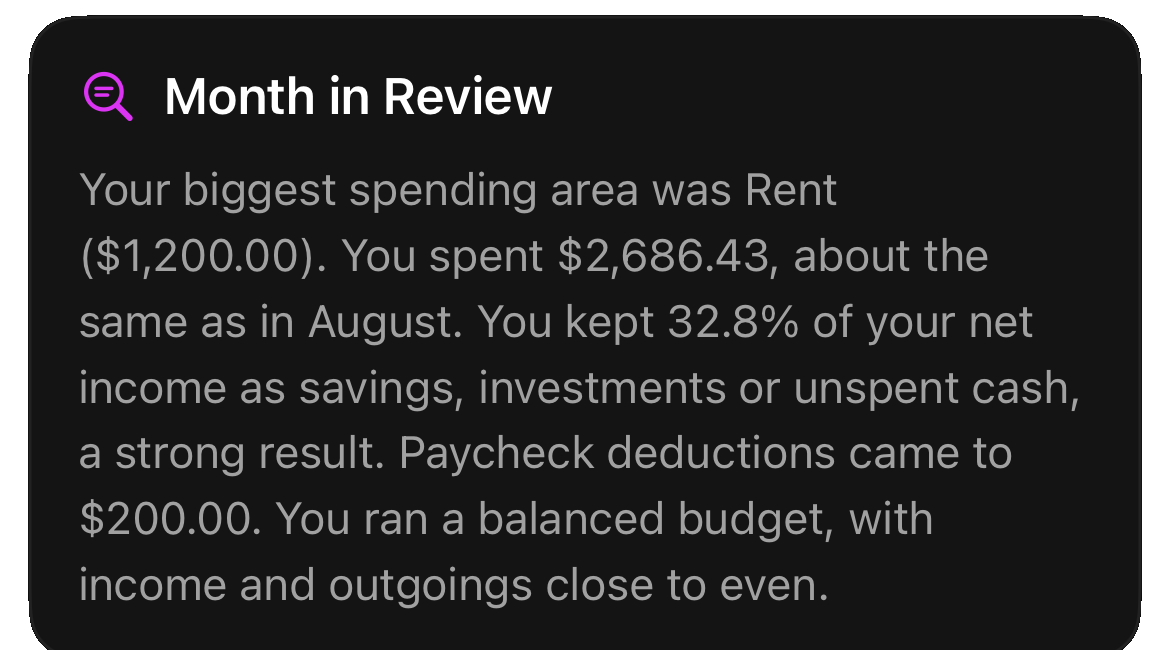
When a month ends, a few plain sentences: where most of it went, how it compares with the month before, and what you kept.
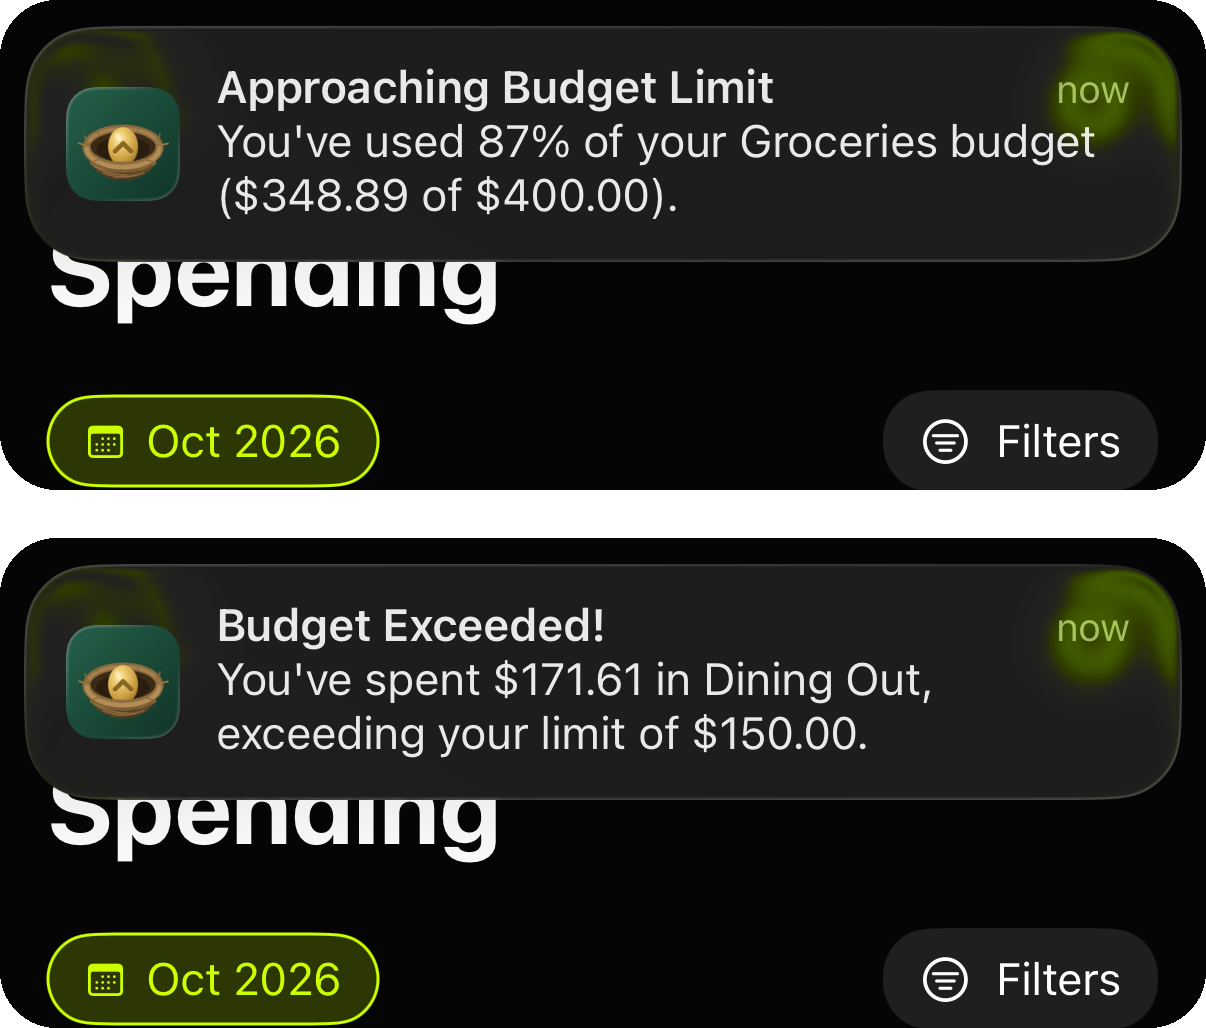
A notification when a category nears its monthly limit, and another if it goes past it. Once each, never a stream of them.
Because most of them need your bank login first. Here’s how NestUp compares with the usual options.
| NestUp | Bank-linked budget apps | Spreadsheets | Your bank’s app | |
|---|---|---|---|---|
| Needs your bank login | No | Yes | No | Yes |
| Where your data lives | Your phone only | Their servers | Your files | Your bank |
| Covers every bank and card you use | Yes | While each connection works | If you type it all in | That bank only |
| Shows what tax and deductions took from your pay | Yes, per employer | Sees the deposit only | If you build it | Sees the deposit only |
| Warns before a budget runs out | Yes | Yes | No | Some |
| Getting purchases in | A tap or Siri, seconds each | Automatic, then fixing categories | Typed by hand | Automatic, that bank only |
One difference to know: NestUp doesn’t pull purchases from your bank. That’s how your login and your history stay off other people’s servers. Logging takes one tap, and seeing each purchase as you log it helps you catch spending while it’s happening.
The everyday tools, kept on your phone like everything else.
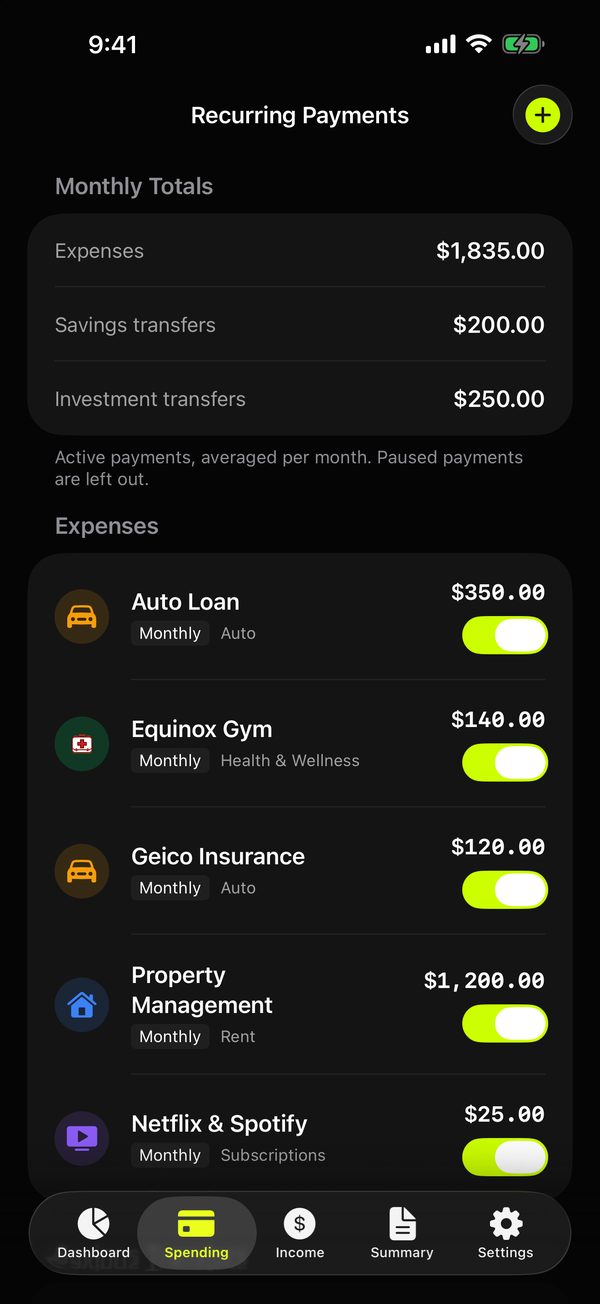
Rent, subscriptions, transfers to savings: set them up once and NestUp logs each one when it’s due. See what they cost a month, by kind, and which card or account pays each.
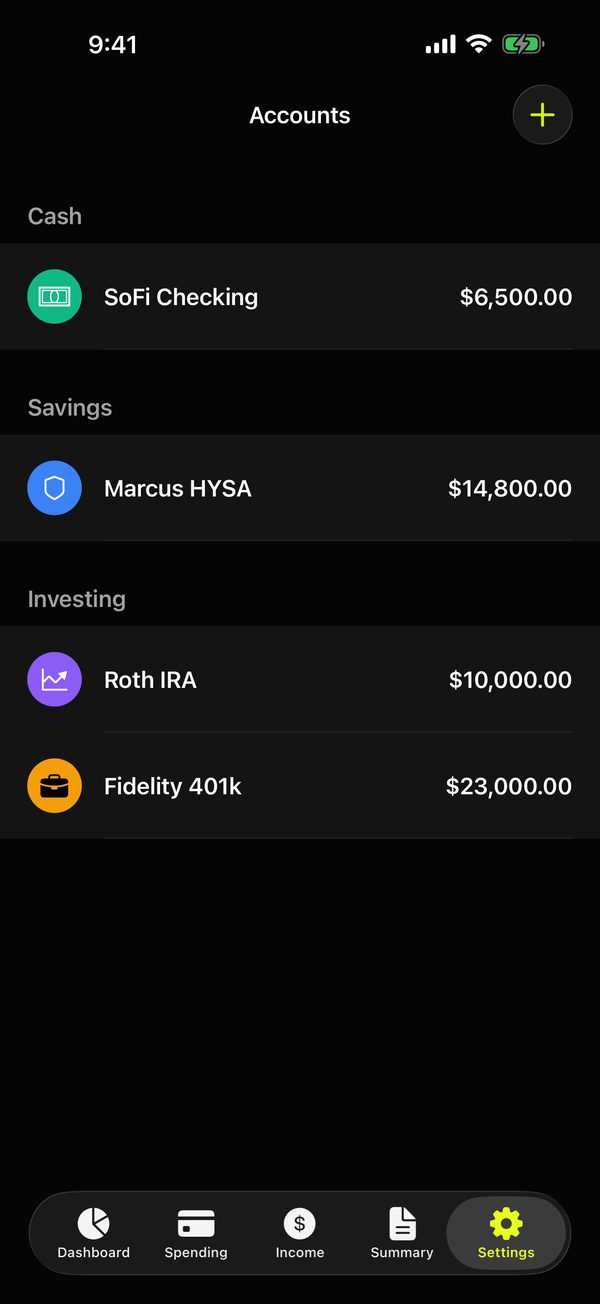
Pause · Resume · RescheduleAdd your cash, savings and investment accounts, and what you still owe on loans. NestUp shows what you’re worth today, with debts counted against it.
Net worthLog an expense from your Home Screen or Lock Screen, or just say “Log an expense in NestUp.”
Quick addTracking your money is free, with no time limit and no ads. PRO adds dashboards, themes and room to grow.
$0
from $3.99 a month
Prices are in US dollars; the App Store shows yours in your own currency. Every purchase goes through Apple, so we never see your payment details. Cancel a subscription any time in Settings. If PRO ends, nothing you made is deleted or locked. More about PRO
Every calculation happens on your phone. There is no server of ours holding your finances, and nothing for anyone to leak, subpoena, or sell. Four things you can check for yourself:
Learn How We Protect YouNo Plaid, no linked accounts, no read access to anything you own.
Nothing to sign up for. Your ledger is stored locally with SwiftData, on your device only. Back it up to one file whenever you want your own copy, and restore it on a new iPhone.
No crash logs, no identifiers, no third-party trackers compiled into the app.
A backup file, a PDF statement or a CSV export, when you ask for it, to wherever you choose. Nowhere else.
That’s all it takes to see your money clearly. Here’s what you’ll have at the end of it.
Every dollar of your paycheck, sorted into needs, wants, savings and investing.
Month in Review tells you where most of it went and how much you kept.
What you actually saved and invested. From month two, you watch that line climb.
Free to download. PRO is optional, from $3.99 a month. See pricing
In January, Lifetime PRO opens at a founder price for 30 days. Leave your email and we’ll tell you the day it starts. Nothing else.
Let us know what you think of NestUp. We read every submission!